Ad Hoc Reporting Definition Your Guide to On-Demand Insights
Ad hoc reporting is all about creating a one-time, custom report to get a fast answer to a specific business question. Think of it like this: a scheduled car maintenance check versus grabbing a diagnostic tool the second your "check engine" light flashes on.
What Is Ad Hoc Reporting Really About
Standard reports are your car’s routine check-up—they're predictable, scheduled, and great for keeping an eye on long-term health. They tell you what is happening with your key metrics, week in and week out. But what do you do when something completely unexpected happens?

This is where ad hoc reporting really shines. It’s an investigative tool, not just a monitoring one. It gives you the power to build a report from the ground up to figure out why something is happening, right now. For newsletter operators and B2B marketers, this means you can ask urgent questions and get answers immediately, without getting stuck in a long IT ticket queue.
The Shift to Self-Service Insights
This need for quick answers isn't anything new. Ad hoc reporting, which comes from the Latin phrase for "as needed," became a go-to business intelligence tool back in the early 2000s as data analytics software took off. By 2010, the demand for self-service reporting had exploded, with 70% of business users wanting to build their own reports—a huge leap from just 25% in 2005. The big driver was the need to get around slow, rigid reporting cycles managed by IT departments.
Instead of waiting weeks for an analyst to pull the data, you can instantly dig into critical questions like:
- Why did last week’s email to our European segment completely tank?
- Which subject line drove the most clicks from our newest subscriber group?
- Did our latest feature announcement actually cause a spike in user engagement?
Ad hoc reporting changes data from a passive, historical record into an active, strategic tool. It’s about finding answers on your own terms, directly within your marketing and newsletter https://joinbreaker.ai/newsletter-glossary/analytics.
This ability to generate insights on demand is a game-changer. If you want to dive deeper into the concept, you can learn more about what is ad hoc reporting and its benefits.
Ad Hoc Reporting Versus Standard Reporting
It’s a common misconception to see ad hoc and standard reporting as competing methods. In reality, they're two sides of the same data coin. They work in tandem to give you a complete picture of your campaign performance, each serving a distinct but complementary role.

Think of standard reports as your steady, scheduled check-ins—like your weekly performance dashboards or monthly KPI summaries. They provide strategic stability, tracking the same key metrics over time to tell you what is happening with your marketing.
Ad hoc reports, on the other hand, are your investigative tool. They give you tactical flexibility. When a standard report flags something unusual, an ad hoc report is how you dig in and figure out why it’s happening.
How They Work Together
Let’s walk through a real-world example. Imagine your standard weekly dashboard shows a sudden 25% spike in unsubscribes from last week’s newsletter. Your dashboard tells you the "what," but it stops there. This is where you pivot to ad hoc reporting.
You can immediately pull a one-off report to start asking pointed questions and investigate the "why":
- Was the spike tied to a specific subject line or send time?
- Did one particular subscriber segment have a much higher unsubscribe rate?
- Was there a piece of content in that specific newsletter that might have caused a negative reaction?
Standard reports are like the smoke alarm—they alert you to a potential issue. Ad hoc reports are the firefighter investigating the source of the smoke, giving you the specific information needed to take action.
This approach gives you a complete, data-driven workflow. For a deeper look at building those essential dashboards, check out our ultimate guide to real-time email analytics dashboards.
This quick comparison table breaks down the core differences at a glance:
Ad Hoc vs. Standard Reporting at a Glance
Ultimately, combining both reporting types gives you the best of both worlds. You maintain a steady pulse on your marketing health with standard reports while having the agility to explore and solve immediate challenges with ad hoc analysis. This ensures you’re never just watching numbers change; you're actively understanding the story behind them.
Why Ad Hoc Reporting Is a Marketing Superpower
In marketing, speed is everything. Standard reports are great for showing you where you’ve been, but ad hoc reporting is the superpower that lets you change direction on the fly. It's about pivoting your strategy based on fresh feedback, not outdated assumptions.
This is what true data agility looks like. Imagine launching a new newsletter subject line in the morning. By the afternoon, you can run a quick, one-off report to see exactly how it performed with your highest-value audience segment. That gives you immediate data to make the next send even better.
From Passive Data to Active Growth
The real magic here is turning your data from a passive, historical record into an active tool for growth. You no longer have to wait in line for an analyst to dig into the numbers for you. This self-service approach empowers your team to test ideas and validate hunches the moment they have them.
For instance, an ad hoc report could reveal that a call-to-action (CTA) button in your latest campaign is bombing with mobile users. You can spot the problem right away and deploy a fix, saving valuable conversions that would have been lost if you’d waited for a monthly review. This is how you use analytics to find and predict high-value leads with laser focus. You can read also about how analytics predicts high-value leads in real-time.
This self-service capability is critical. Ad hoc reports empower organizations to adapt quickly and make informed choices, driving effective strategy and supporting broader data-driven decision making.
This independence makes a huge difference in efficiency. In fact, ad hoc reporting can slash dependency on IT and data teams by up to 75%. When marketers can pull their own numbers, the average number of custom report requests drops from 15 per week to under four, freeing up analysts to focus on much more strategic work.
Putting Ad Hoc Reports to Work on Your Campaigns
Theory is great, but the real magic happens when you use ad hoc reporting to solve everyday marketing problems. Instead of just glancing at high-level trends, on-demand reports let you dig in and answer the specific, nagging questions that lead to smarter decisions and better campaigns.
Let's get practical. Think about the questions you're probably already asking your team. Each one is the perfect jumping-off point for a powerful ad hoc report.
From Questions to Actionable Insights
The trick is to frame a precise question first, then pull the data to answer it. This simple shift turns a generic observation into a focused investigation that points directly to an action you can take.
For instance, you might be wondering about your welcome series:
- Question: “Which email in our new user onboarding sequence has the highest drop-off rate?”
- Data Needed: Open rates, click-through rates, and unsubscribe rates for every email in the sequence, filtered for users who signed up in the last 30 days.
- Potential Action: If Email #3 shows a 40% drop-off, you know exactly where to focus. You can rewrite its subject line, simplify the content, or A/B test a completely different call-to-action.
Here’s another common scenario for a product launch:
- Question: “How does click behavior on our latest feature announcement differ between free users and paid subscribers?”
- Data Needed: Click maps or link click data from that specific campaign, segmented by your "free user" and "paid subscriber" audience lists.
- Potential Action: You might find that paid users are clicking all over the advanced feature links, while free users are heading straight for the pricing page. This insight lets you build two separate, tailored follow-up campaigns that speak to each segment's obvious intent.
An ad hoc report is the bridge between a business question and a confident, data-backed action. It transforms curiosity into a concrete optimization strategy.
This direct, investigative approach has become a must-have for modern marketers. In fact, the use of ad hoc reporting in major markets has fueled a 55% increase in data-driven decisions since 2019. This is especially true in the marketing world, where 68% of B2B campaigns now use on-demand analysis for quick performance tweaks. You can explore more findings on the impact of ad hoc reporting.
How to Create Your First Ad Hoc Report
Jumping into your first ad hoc report might sound a little technical, but the process is surprisingly simple and works pretty much the same across most modern marketing platforms. It all boils down to a logical workflow that starts not with data, but with a question. This isn't about becoming a software wizard; it's about mastering a strategic way to find answers when you need them.
The heart of any good ad hoc report is its purpose: to answer one specific question. This is your non-negotiable first step. Vague goals like "see how the campaign is doing" will only lead you to confusing, messy reports.
Instead, ask something sharp and answerable. For example: "Which subject line from last week's newsletter drove the most clicks from our 'engaged subscriber' segment?"
This simple workflow turns your curiosity into a data-driven action.
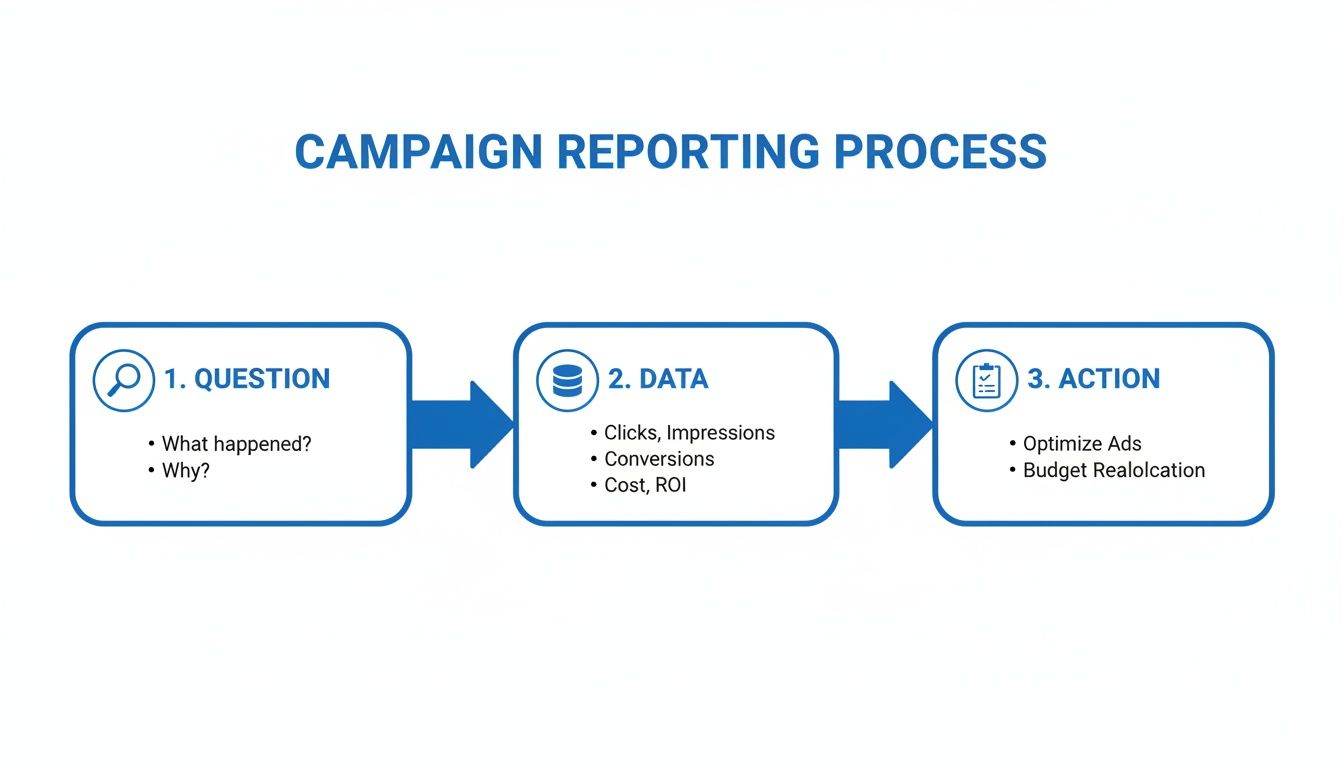
As the diagram shows, a clear question is the foundation. It tells you exactly what data to pull, which ultimately lets you take a confident, informed next step.
A Universal Step-by-Step Framework
Once you have your question locked in, the rest of the process just falls into place. You can follow these steps in nearly any tool, whether it's your email service provider or a dedicated analytics platform.
Select Your Metrics and Dimensions: Based on your question, choose what you need to measure (metrics like click rate or opens) and how you need to group that data (dimensions like subject line or subscriber tag).
Apply Specific Filters: Now, you need to isolate the exact data you're interested in. This is where you’ll apply filters for a specific date range, campaign name, or audience segment to cut through all the noise.
Choose the Best Visualization: Don't just settle for a table of numbers. A bar chart is perfect for comparing a few different subject lines, while a line graph is great for showing performance over a period of time.
The goal is to make the answer to your question immediately obvious. The right chart turns a page of numbers into a clear, compelling story that points directly to a conclusion.
Finally, draw your conclusion and decide what to do next. This is what transforms your ad hoc report from a simple data pull into a powerful tool for making your campaigns better.
Common Questions About Ad Hoc Reporting
Even with a clear definition, a few practical questions always pop up when teams start thinking about ad hoc reporting. Let's clear the air on what it takes to get started, who can do it, and how it fits into your day-to-day workflow.
What Tools Do I Need for Ad Hoc Reporting?
Good news: you probably already have everything you need. Most modern marketing platforms, whether it's a simple newsletter tool or a full-blown automation suite, come with built-in analytics dashboards. These almost always have the filtering and segmentation features that are the heart of ad hoc reporting.
While big enterprises might bring in dedicated business intelligence (BI) software like Tableau or Looker, most marketing teams can answer their most urgent questions with the self-serve tools already in their stack. You don’t need another expensive subscription to start asking better questions.
Is Ad Hoc Reporting Difficult for Non-Analysts?
Not anymore. The days of needing to write complex SQL queries just to pull a simple marketing report are pretty much over. Modern tools are built for business users, with intuitive, visual interfaces where you can often just drag and drop the metrics you want to see.
The real skill isn't technical; it's learning to ask sharp, specific questions. If you can clearly define what you want to discover, you can almost always build the report to find the answer in just a few clicks.
It’s more about curiosity than coding. If you can frame a good question, the tool will handle the heavy lifting.
How Often Should My Team Use Ad Hoc Reporting?
The name gives it away: you use it "as needed." The whole point is to investigate, not just monitor. Your standard dashboards are for your daily or weekly health checks. You turn to ad hoc reports for specific situations, like:
- When you spot something unusual in your standard reports (like a sudden drop in open rates).
- When you want to validate a new idea before committing resources (like testing a new CTA on a small segment).
- When you need a specific data point to back up a strategic discussion or presentation.
Think of it as your go-to tool for deep dives and problem-solving. It’s for moments of curiosity and critical investigation, not something you run on a fixed schedule.
At Breaker, we build analytics directly into your workflow so you can move from question to insight to action in minutes. See how our real-time reporting helps B2B marketers optimize every send without ever leaving the platform. Explore Breaker and start your 7-day trial.