Ultimate Guide to Real-Time Email Analytics Dashboards
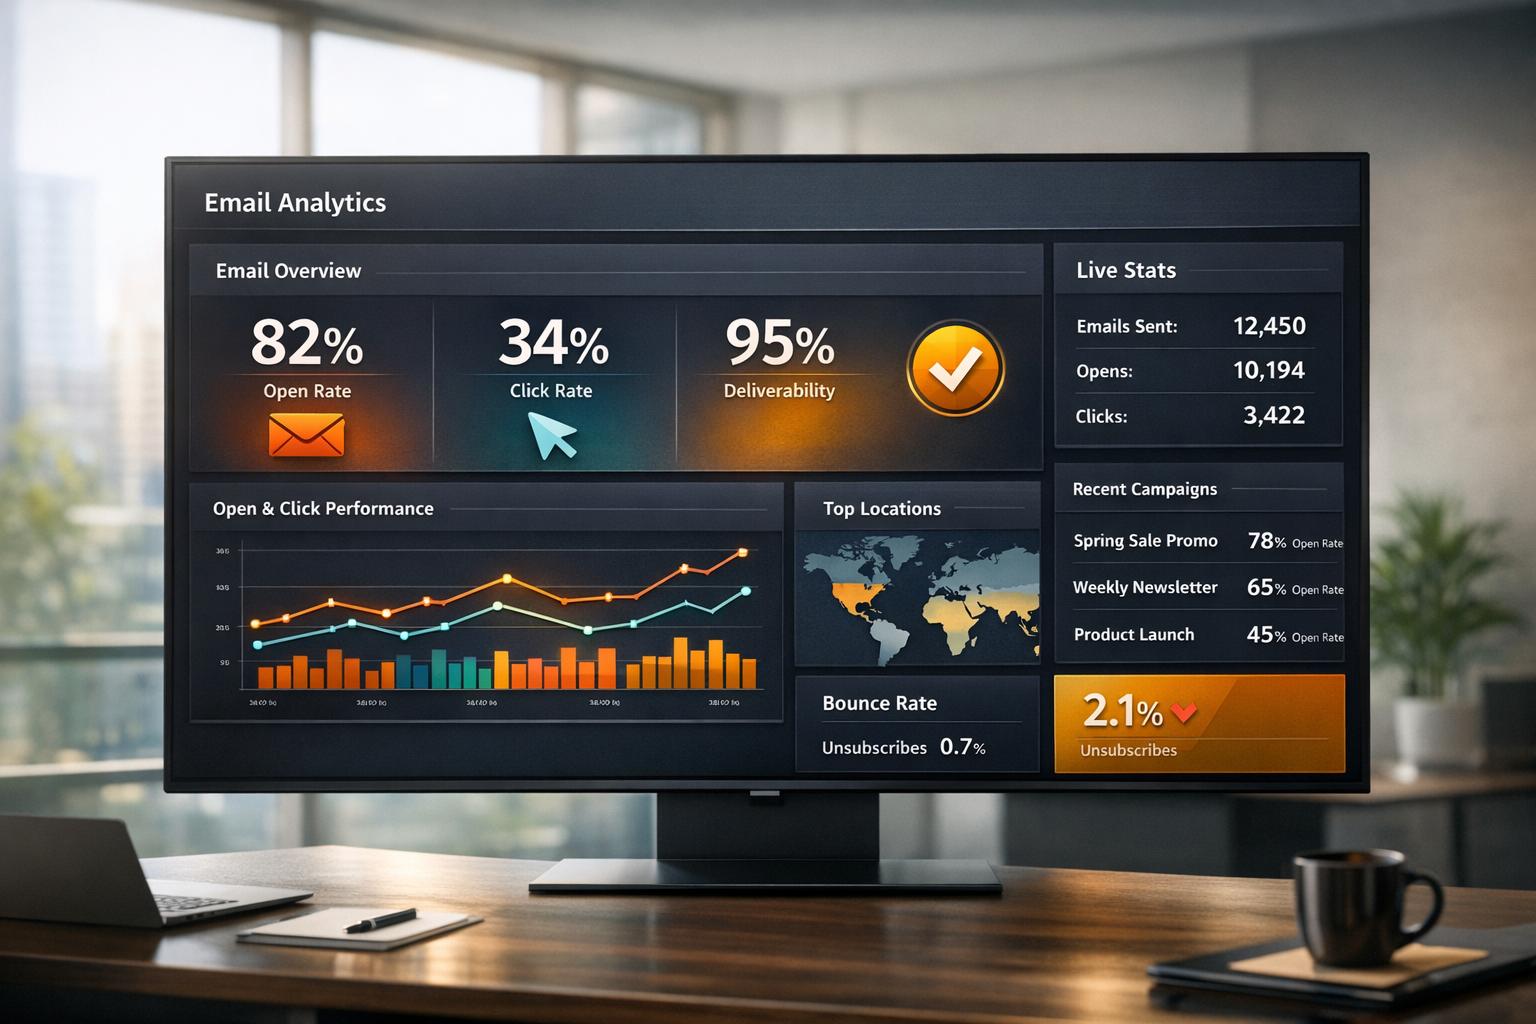
Real-time email analytics dashboards give you live, actionable insights into your email campaigns as they happen. Unlike traditional tools that deliver delayed data, these dashboards let you track metrics like open rates, click-through rates, and deliverability in real time, enabling immediate adjustments to improve performance and protect sender reputation.
Key Benefits:
- Instant Insights: Monitor over 40 metrics in real time, including opens, clicks, and bounce rates.
- Proactive Adjustments: Spot and fix issues like high bounce rates or spam complaints immediately.
- Enhanced ROI: Optimize campaigns mid-flight based on live performance data.
- Deliverability Monitoring: Track blocklist hits, DMARC failures, and domain-specific issues to safeguard inbox placement.
Top Metrics to Watch:
- Engagement Metrics: Open rate, click-through rate (CTR), reply rate, and unsubscribe rate.
- Delivery Metrics: Bounce rates (hard <2%, soft issues), deliverability by domain, and spam complaints (<0.1%).
- Link Performance: Unique clicks, total clicks, time-to-click, and heatmaps for CTA optimization.
Setup Essentials:
- Tools: Email service provider (ESP), CRM, and analytics software.
- Key Components: Data sources, processing engine, visualization tools, and real-time alerts.
- Integration: Connect platforms like Google Analytics or CRMs for a full picture of your email funnel.
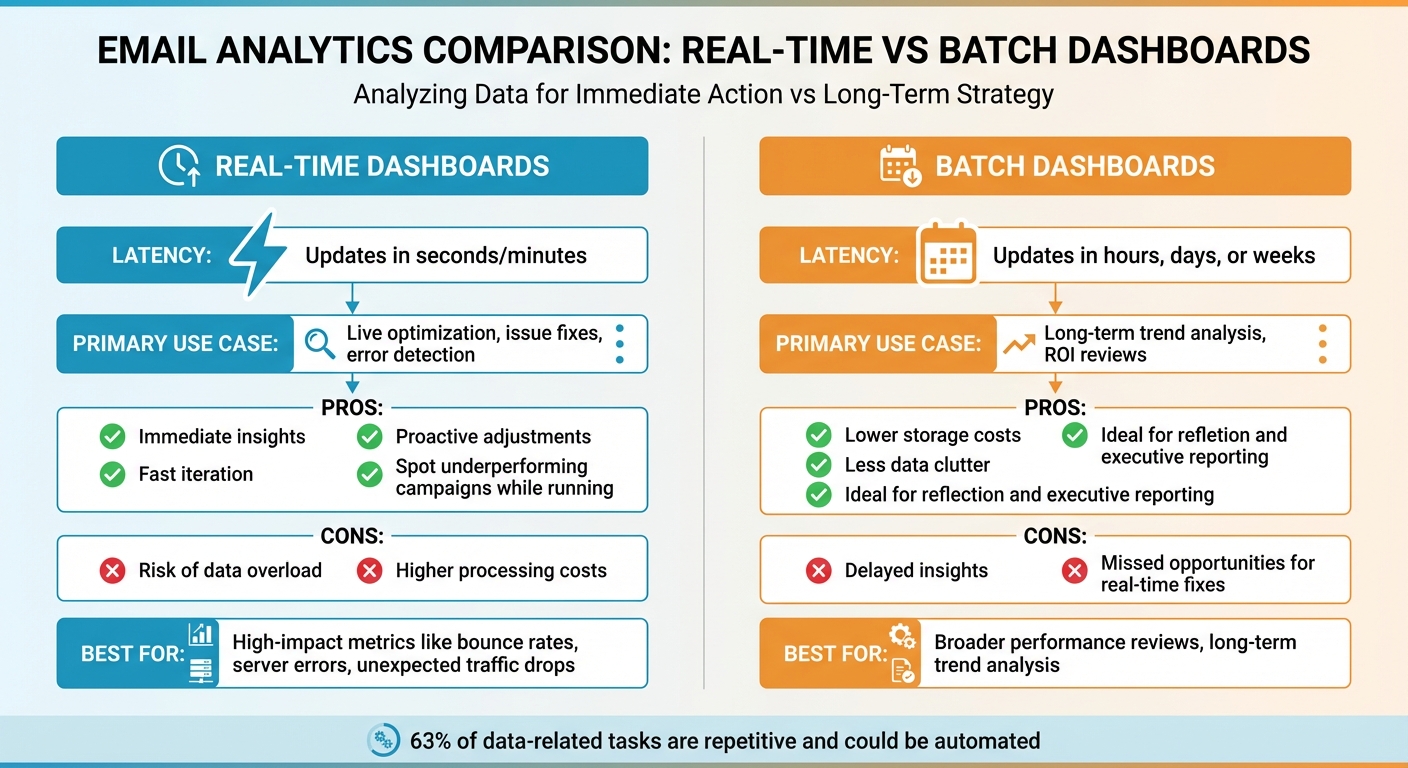
Real-Time vs. Batch Dashboards:
| Feature | Real-Time Dashboards | Batch Dashboards |
|---|---|---|
| Latency | Updates in seconds/minutes | Updates in hours/days |
| Use Case | Live optimization, issue fixes | Long-term trend analysis |
| Pros | Immediate insights | Lower processing costs |
| Cons | Higher processing costs | Delayed insights |
Real-time dashboards are essential for B2B marketers managing complex sales cycles. They ensure timely responses to high-value prospects, protect sender reputation, and maximize the ROI of email marketing campaigns. Start by integrating your tools, setting up alerts, and focusing on key metrics to stay ahead.
Key Metrics to Track in Real-Time Dashboards
Engagement Metrics
Open rate is a useful indicator of how well your subject lines and sender name resonate with recipients. However, with Apple's Mail Privacy Protection enabling automatic image loading, this metric has become less reliable. It's best to pair it with other data points for a clearer picture.
Click-through rate (CTR) measures how many recipients clicked on a link in your email. To dig deeper, use the click-to-open rate (CTOR) - this compares unique clicks to unique opens, showing whether your email content lived up to the promise of your subject line.
For B2B campaigns, reply rate is a key performance indicator (KPI) that reflects genuine interest and potential leads entering your pipeline. At the same time, keep an eye on unsubscribe rates and spam complaints. A spam complaint rate over 0.1% can harm your domain’s reputation and email deliverability. Once you’ve got engagement metrics covered, move on to delivery metrics to ensure your emails are reaching the inbox.
Delivery Metrics
Keeping your bounce rate low is critical. Hard bounces - caused by invalid email addresses - should stay under 2%. Regularly clean your list to remove these contacts, as internet service providers (ISPs) use bounce rates to identify spammers. Soft bounces, caused by temporary issues like full inboxes, can also signal potential problems with your sending infrastructure if they occur frequently.
Track deliverability by domain to spot any provider-specific issues. Real-time alerts for blocklist hits or DMARC failures can help you address problems before they escalate. Since email lists naturally decay by about 22.71% each year, proactive list maintenance is essential. Lastly, evaluating link performance provides insights into how recipients engage with your content on a deeper level.
Link Performance Metrics
When analyzing link performance, go beyond basic CTR by distinguishing between unique clicks and total clicks. Unique clicks show how many individual recipients engaged, while total clicks can indicate repeated interest if recipients clicked multiple times. Use link tables to identify which calls-to-action (CTAs) are driving the most engagement.
Time-to-click measures how quickly recipients interact with your email, offering clues about the urgency of your message. Some platforms also provide heatmaps to visualize click activity within your email, helping you optimize CTA placement and design. To filter out automated bot clicks, consider using hidden links, such as white-on-white text, which can differentiate genuine engagement from automated scans.
| Metric | Cold Outreach Benchmark | Warm List Benchmark |
|---|---|---|
| Open Rate | 20–30% | 40–60% |
| CTR | 2–5% | 10–20% |
| Reply Rate | 5–15% | 20%+ |
| Bounce Rate | <2% | <1% |
| Spam Complaints | <0.1% | <0.1% |
How To Use A Dashboard To Analyze Email Campaign Performance? - TheEmailToolbox.com
Benefits of Real-Time Dashboards for Email Campaigns
Real-Time vs Batch Email Analytics Dashboards Comparison
Make Campaign Adjustments Immediately
With real-time dashboards, you can tackle issues as soon as they arise. Automated alerts - whether through email, SMS, or Slack - notify your team the moment something goes off track.
These dashboards also help identify where subscribers might be dropping off in your automated workflows. For example, if recipients aren’t progressing to the third email in a nurture sequence, live "Flow Volumes" data can highlight the problem. Whether it’s a technical glitch or a misconfigured trigger, you’ll know exactly where to focus your efforts.
Improve ROI Through Data-Driven Decisions
After addressing immediate concerns, real-time insights can help maximize your return on investment (ROI). On average, email marketing generates $36 for every $1 spent. With real-time dashboards, you can keep an eye on key performance indicators like Revenue Per Email (RPE) as your campaigns unfold, enabling you to double down on strategies that are working.
Take Mercari, for instance. Between 2014 and 2017, they used live engagement data to tailor experiences for sellers, boosting their U.S. gross merchandise volume by 70% year-over-year and reaching 2 million monthly active users. Similarly, Peacock’s personalized "year-in-review" campaign, powered by real-time data, led to a 20% drop in churn over 30 days and a 6% increase in upgrades from free to paid subscriptions. These examples show how leveraging live data can directly enhance your campaign performance.
Manage Deliverability Proactively
Beyond immediate fixes and ROI gains, real-time monitoring is essential for maintaining email deliverability. Your sender reputation plays a critical role in determining whether your emails land in inboxes or get flagged as spam. Real-time dashboards track important authentication protocols like SPF, DKIM, and DMARC, sending alerts when something needs attention.
For context, major email providers like Gmail and Yahoo require spam complaint rates to stay under 0.3% - that’s no more than three complaints per 1,000 emails sent. By monitoring deliverability in real time, you can address potential issues before they harm your domain reputation. As Laura Christensen, Sr. Director of Professional Services at Validity, explains:
"Your reputation as a sender directly impacts your deliverability and your inbox placement. And there are many different metrics that make up your reputation. It's not just one metric, it's a combination of factors, including spam traps, rejected rate, spam complaints, and unknown users."
Modern analytics platforms take this a step further, tracking over 40 real-time metrics and performing more than 100 internal checks across 30 key sending areas. This level of visibility ensures you can safeguard your inbox placement while setting the foundation for refining your dashboard setup.
How to Set Up a Real-Time Email Analytics Dashboard
Prerequisites for Setup
To get started, you'll need four key components: data sources (like email event feeds), a data processing engine (to organize raw data), a visualization layer (such as a BI tool or frontend app), and interactive controls (filters and alerts for better usability). On the technical side, ensure you have Node.js (version 18 or higher) and Python (version 3.8 or higher) if you're handling pipelines via command-line tools. It’s also a good idea to use Docker Desktop for local testing of your data pipelines before deployment.
Access credentials are just as important. Make sure you have admin rights for your email service provider, API tokens to secure the data flow, and integration keys for connecting to tools like CRMs or web analytics platforms. If you're using advanced tools like Looker Studio with Google Analytics 4, ensure you have access to BigQuery. This allows you to pull real-time data from "events_intraday" tables, avoiding the typical 24- to 48-hour delay in GA4 reporting.
Once you have these technical and access requirements ready, you can move on to building your dashboard step by step.
Step-by-Step Setup Process
With the essentials in place, you can now create a dashboard that provides real-time, actionable insights for your email campaigns.
Start by defining your audience and objectives. For instance, an email marketer might need detailed metrics like the click-to-open rate (CTOR) by segment, while an executive might focus on overall ROI and pipeline impact. Choose 5–10 key metrics that align with your goals - prioritize those that inform decisions, like identifying campaigns that drive enterprise MQLs (Marketing Qualified Leads).
Next, pick a visualization platform that integrates well with your existing tools. Google users often prefer Looker Studio, while Microsoft organizations might lean toward Power BI. Connect your data sources: your ESP (email service provider) for engagement metrics, your CRM for lead tracking, and your website analytics for post-click behavior. Configure queries to follow the email funnel - from email_processed to email_click - to pinpoint where users drop off.
For visualizations, use line charts to highlight trends, bar charts for campaign comparisons, and large scorecards to display totals like email-generated revenue. Automate data refresh intervals: Power BI Premium can refresh as often as every second, while Looker Studio with BigQuery supports one-minute intervals. Set up alerts via Slack or email for threshold breaches, so your team can respond quickly.
Once your dashboard is live, you can fine-tune it by applying customization best practices.
Best Practices for Dashboard Customization
Position your most important KPIs in the top-left corner for maximum visibility. Organize metrics by funnel stages - for example: Deliverability (bounces, spam complaints), Engagement (CTR, CTOR), Conversion (revenue per email), and List Health (growth rate, churn). Add filters for granular control, allowing users to sort data by campaigns, flows, device types, or email domains.
For real-time performance, consider using columnar databases like ClickHouse. These are optimized for high-throughput streaming and can deliver query results in as little as 1.1 milliseconds. To save resources, replace fixed refresh intervals with "Change Detection" logic - this updates visuals only when new data is available (e.g., using MAX(timestamp)). Lastly, review your KPIs quarterly to remove outdated metrics and keep the dashboard relevant.
sbb-itb-8889418
Breaker's Real-Time Analytics Features
Key Features of Breaker's Analytics Tools
Breaker’s platform offers real-time tracking for opens, clicks, and replies, giving you actionable insights right when you need them. With tools like the Newsletter Engagement Score and AI-powered Send Time Optimization, emails are delivered at the most effective times during standard B2B work hours. Its Predictive Lead Analytics identifies high-value leads by analyzing interaction patterns, while behavioral triggers handle follow-ups automatically - like sending a customized case study just minutes after someone clicks on a pricing link.
These features make it easier to streamline your email strategy and maximize engagement.
Integrating Breaker with Your Workflow
Breaker simplifies integration by using webhooks to instantly send email event data to your CRM or helpdesk, eliminating the need for constant API polling. You can set up real-time notifications through Slack or Microsoft Teams using tools like Zapier. For broader team visibility, data can also be sent directly to platforms like Google Sheets or Airtable. Additionally, Breaker’s direct CRM integrations enable highly personalized, automated email sequences based on prospect activity.
With seamless integration options, Breaker ensures your email campaigns are not just efficient but also highly targeted.
How Breaker Ensures High Deliverability
Maintaining email deliverability is a priority for Breaker. The platform continuously validates email addresses to filter out spam traps and hard bounces before sending. If a hard bounce occurs, the system automatically marks the address as unsubscribed to protect your sender reputation. Breaker also keeps tabs on DMARC failures and blocklist appearances, pausing campaigns or issuing alerts when necessary to safeguard deliverability.
Advanced Features and Optimization Strategies
Once your dashboard is set up, it’s time to unlock its full potential. By diving into advanced tools and strategies, you can gain deeper insights and make more precise adjustments to your email campaigns. With Breaker’s analytics, these features allow you to refine your approach and achieve better results.
Use Filters and Parameters for Detailed Insights
Filters are your best friend when it comes to analyzing specific aspects of your campaigns. You can break down data by campaign type, audience segment, or even geographic location. For example, if you notice high mobile open rates but low clicks, it might be time to tweak your mobile email templates. Want to dig deeper? Compare performance across email domains, such as Gmail versus Outlook, to uncover potential deliverability issues unique to certain providers.
Time-based parameters are another powerful tool. By comparing recent performance metrics, you can quickly spot trends or shifts in engagement. Many advanced platforms track over 40 real-time metrics, giving you the flexibility to focus on what truly matters. Use engagement filters like "never opened" or "bounced" to automate list cleaning and protect your sender reputation. These tools ensure you’re monitoring your email funnel with precision and in real time.
Monitor Pipeline Health in Real-Time
Keeping an eye on your pipeline in real time is crucial for catching and fixing issues before they snowball. For instance, a sudden drop in subscriber flow might signal a broken automation trigger or a sync error. By tracking the entire funnel - from emails sent to delivered, opened, clicked, and converted - you can pinpoint where prospects are falling off.
"Waiting until a report is ready often means the campaign is already over. A dashboard gives you real-time visibility, so you can spot underperforming campaigns while they're still running." - Nadia Basaraba, Marketing Specialist, Coupler.io
Set up instant alerts for critical issues like a spike in hard bounces or being flagged on a blocklist. These alerts help protect your sender reputation while ensuring your pipeline remains steady.
Real-Time vs. Batch Dashboards: Pros and Cons
When it comes to dashboards, the choice between real-time and batch processing depends on your goals. Real-time dashboards update within seconds or minutes, making them ideal for spotting and fixing errors or optimizing campaigns as they run. Batch dashboards, on the other hand, process data at regular intervals - daily, weekly, or monthly - making them better for analyzing long-term trends and assessing ROI.
| Feature | Real-Time Dashboards | Batch Dashboards |
|---|---|---|
| Latency | Updates in seconds or minutes | Updates in hours, days, or weeks |
| Primary Use | Quick error fixes and live campaign optimization | Long-term trend analysis and ROI reviews |
| Pros | Immediate insights; proactive adjustments; fast iteration | Lower storage costs; less data clutter; ideal for reflection |
| Cons | Risk of data overload; higher processing costs | Delayed insights; missed opportunities for real-time fixes |
To strike the right balance, reserve real-time monitoring for high-impact metrics like bounce rates, server errors, or unexpected traffic drops. For broader performance reviews and executive reporting, batch dashboards are often more practical and cost-efficient.
Troubleshooting Common Issues in Real-Time Dashboards
Even the most well-designed dashboards can encounter hiccups. Connection errors, sync failures, and refresh delays are among the most frequent challenges, but with a few focused steps, they’re often easy to address.
Fix Connection and Data Sync Errors
Many connection issues stem from expired API credentials or deleted connections in your Email Service Provider (ESP). If your dashboard stops pulling data unexpectedly, start by checking if your Client ID or Secret has been updated. Instead of trying to edit expired credentials, delete the old ESP connection and set up a new one with the updated details.
Another common issue is API quotas and rate limits. For instance, hitting Marketo's export quota can delay syncs for days. To resolve this, pause non-essential exports or request a quota increase from your provider. Additionally, watch out for data type mismatches - if your dashboard expects a Date/Time format but the source table uses plain text, the refresh process will fail entirely.
For users of DirectQuery dashboards (like Power BI), query folding issues can cause timeouts and crashes. When query folding isn’t supported by your data source, the system attempts to pull all the data instead of just the filtered subset, leading to performance problems. Use SQL Profiler to ensure filters are applied at the source level before publishing. For large datasets, consider enabling "Large model storage format" or shortening the refresh period - switching from a full year to 12 months can make a big difference.
Once connection and sync errors are resolved, the next step is tackling refresh delays and latency.
Handle Refresh Delays and Latency
After addressing connection and sync issues, focus on overcoming refresh delays that can disrupt real-time data accuracy.
It’s important to note that “real-time” rarely means instantaneous. Many integrations sync on fixed schedules. For example, Salesforce Marketing Cloud and Eloqua typically update every 6 hours, while Marketo may only sync twice a day. If your data appears outdated, start by checking the sync intervals for your integrations.
Another common issue is visual caching. Dashboards often cache results to conserve processing power, which can result in displaying outdated metrics even when new data is available. To address this, configure Automatic Page Refresh or set up Change Detection (e.g., using MAX(timestamp)) to update visuals only when new data arrives. This approach minimizes server load while ensuring you see updated metrics when they matter most. Keep in mind that Power BI Pro users on shared capacity are limited to a 2-hour refresh window, whereas Premium capacity extends this to 5 hours.
| Error Type | Common Cause | Recommended Solution |
|---|---|---|
| Structural Sync Error | Expired API credentials or deleted ESP connection | Delete and recreate the ESP connection in dashboard settings |
| Refresh Timeout | Data volume too large or lack of query folding | Enable "Large model storage format" or reduce refresh period |
| Data Truncation | Exceeding source query limits (e.g., 64 MB) | Specify smaller refresh and store periods to reduce payload |
| Missing Real-Time Data | Visual caching | Configure Automatic Page Refresh or Change Detection |
Conclusion and Key Takeaways
Real-time email analytics dashboards are now a game-changer for B2B marketing. They simplify workflows, automate reporting, and tie email engagement directly to revenue, giving marketers a competitive edge.
Why Real-Time Dashboards Matter
Real-time dashboards provide immediate insights that can reshape your email campaigns. Instead of waiting days to realize a campaign isn’t performing, you can spot and address issues as they happen - whether it’s tweaking a subject line or adjusting a call-to-action before your budget takes a hit. These tools also protect your sender reputation by catching spikes in bounces or spam complaints early, helping you avoid long-term deliverability problems.
Beyond crisis prevention, dashboards save time by consolidating data. Considering that 63% of data-related tasks are repetitive and could be automated, these tools free up your team to focus on strategy rather than wrestling with spreadsheets. The result? A clear path to maximizing ROI through smarter, faster decision-making.
Steps to Get Started with Real-Time Analytics
To kick things off, start by auditing your technical setup - make sure SPF, DKIM, and DMARC protocols are in place to protect deliverability. Next, integrate your email platform with your CRM and web analytics tools to track every step of your customer’s journey, from the first email to final revenue. Set up real-time alerts (via Slack or email) to flag critical issues like blocklist hits or sudden spikes in unsubscribes.
For those ready to take the next leap, consider platforms designed specifically for B2B marketers. Breaker’s platform, for instance, turns email data into booked calls and measurable results. As Josh Durham, CEO of Aligned Growth Media, highlights:
"Breaker is our #1 source of booked calls".
FAQs
How can real-time email analytics dashboards enhance my marketing campaigns?
Real-time email analytics dashboards give you instant access to essential metrics like open rates, click-through rates, bounce rates, and even revenue generated per email. By continuously updating with data pulled from your email platform, CRM, and other tools, these dashboards let you spot trends, spikes, or dips in performance as they happen. This means you can take quick action - whether it’s adjusting subject lines, fine-tuning audience segments, or modifying send times - to keep your campaigns performing at their best.
These dashboards also bring all your data together in one clear, easy-to-navigate interface. By consolidating information from multiple sources, they eliminate the need for fragmented reporting and provide your team with a single, reliable view of performance. This unified perspective helps you identify which campaigns are driving the most revenue, uncover deliverability problems, and see exactly where prospects lose interest. Armed with these insights, you can focus on strategies that boost ROI and ensure your campaigns stay relevant and effective.
What do I need to set up a real-time email analytics dashboard?
To create a real-time email analytics dashboard, start by pinpointing what you want to achieve. Are you aiming to track open rates, click-through rates, bounce rates, or even revenue per email? Your chosen metrics should directly support your goals - whether that's understanding email deliverability, gauging engagement, or evaluating the overall performance of your campaigns.
Once your goals are clear, focus on building a dependable data pipeline. Start by cleaning up your subscriber list to eliminate invalid or potentially risky email addresses. Then, integrate your email platform with any additional tools you use, like CRMs or databases, through APIs. This setup ensures a seamless flow of real-time data into a centralized system.
The final step is creating the dashboard itself. You can use either a dedicated dashboard tool or the analytics features built into your email platform. Design the interface to be intuitive, highlighting your most important metrics. Set default date ranges, like the past 30 days, and enable automatic updates so the dashboard refreshes in real time. This way, you’ll have instant access to actionable insights without the hassle of manual reporting.
How does real-time monitoring improve email deliverability?
Real-time monitoring lets you spot issues like bounces, spam complaints, or delivery failures the moment they occur. This means you can act fast - whether it’s cleaning up your email list or tweaking your sending practices - to safeguard your sender reputation.
A strong sender reputation directly impacts your inbox placement rates, helping your emails consistently land where they’re meant to: in your audience’s inbox. Staying ahead with real-time insights is essential for keeping your deliverability on track.