16 Metrics to Track for Newsletter Success
Newsletters can do more than just deliver updates - they can help drive real business results like leads, sales, and revenue. To make this happen, you need to track the right metrics. Here’s a quick breakdown of the 16 most important ones:
- Open Rate: Measures how many people open your emails. Privacy features can skew this data, but trends still matter.
- Click-Through Rate (CTR): Tracks the percentage of recipients clicking on your links - a key indicator of content relevance.
- Click-to-Open Rate (CTOR): Shows how effective your email content is for those who open it.
- Subscriber Engagement Rate: Helps identify active vs. inactive subscribers.
- Bounce Rate: Tracks failed email deliveries - keep it under 2% to avoid issues.
- Unsubscribe Rate: Measures opt-outs; aim for less than 1%.
- Spam Complaint Rate: Should stay below 0.1% to maintain sender reputation.
- List Growth Rate: Monitors how fast your subscriber base grows (or shrinks).
- Conversion Rate: Shows how many recipients take a desired action (e.g., purchase, signup).
- Revenue Per Email (RPE): Calculates how much revenue each email generates.
- Customer Lifetime Value (CLV): Tracks the total revenue a subscriber brings over time.
- Lead-to-Customer Conversion Rate: Measures how effectively your emails turn leads into paying customers.
- Time Spent Reading: Tracks how long recipients engage with your content.
- Most Clicked Links: Reveals which parts of your email drive the most interest.
- Device and Email Client Usage: Ensures your emails work well across devices and platforms.
- Heatmaps for Link Engagement: Visualizes where readers click, helping improve layout and design.
Focus on these metrics to understand your audience, improve content, and link your efforts to measurable business outcomes. Tools like Breaker can simplify tracking by offering centralized, real-time analytics. Start by selecting at least one metric from each category (engagement, growth, revenue, and deliverability) for a balanced approach to optimizing your newsletters.
16 Essential Newsletter Metrics to Track for Success
Email Marketing KPIs: Track These for Newsletter Success! #DigitalMarketing
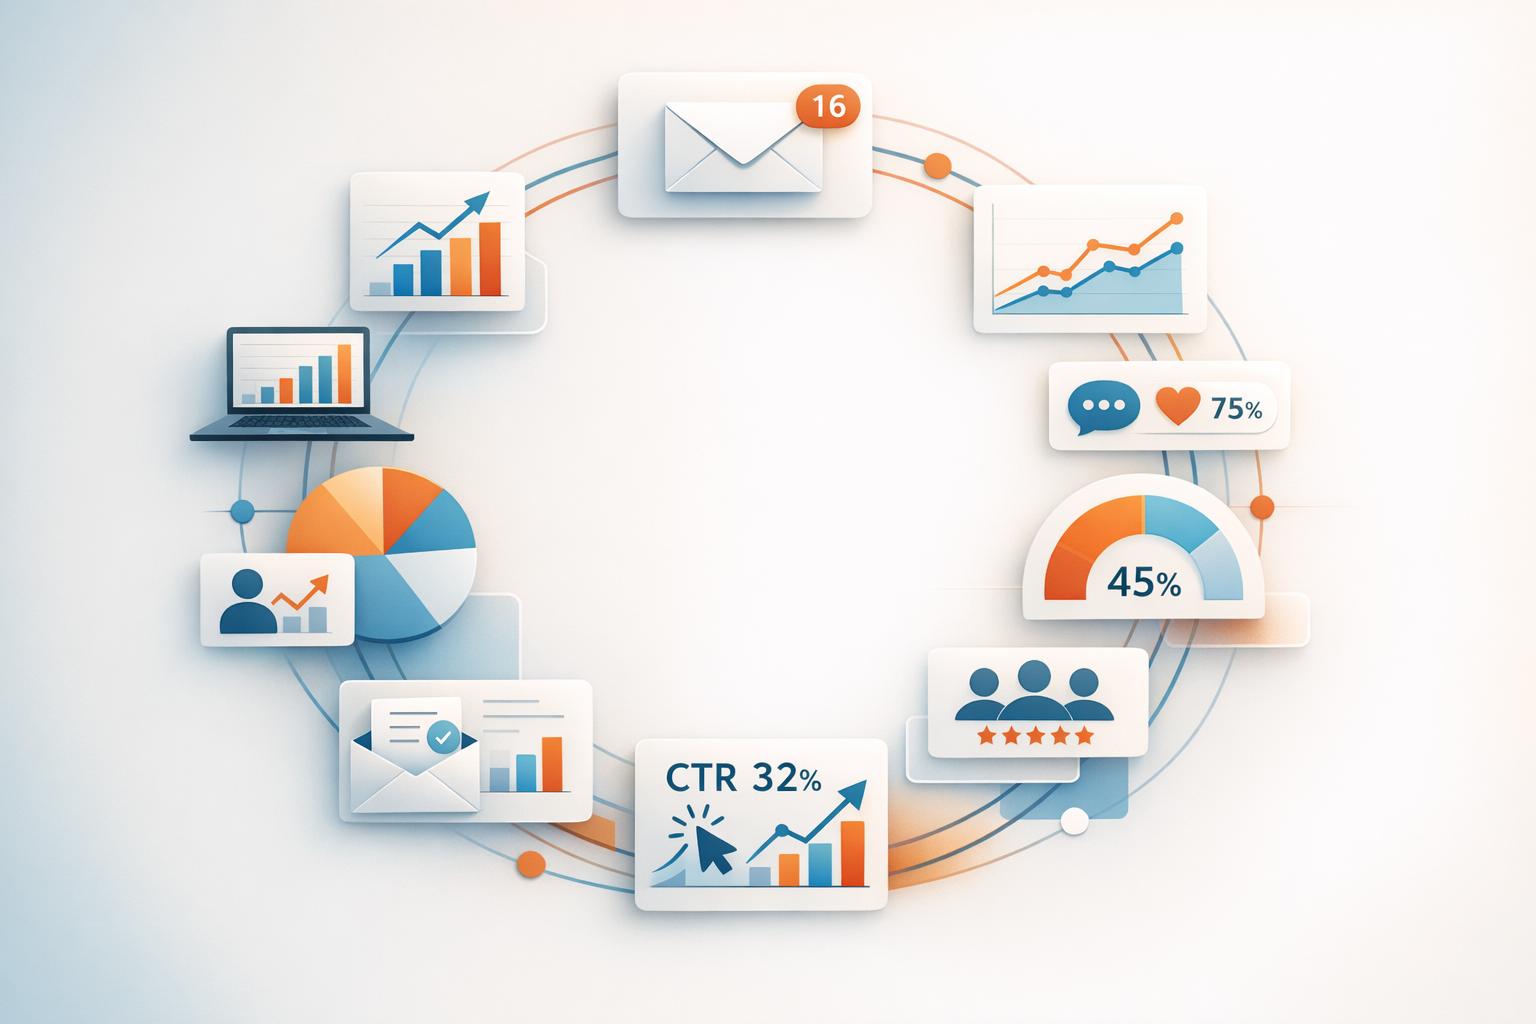
Core Engagement Metrics
Engagement metrics reveal how well your newsletter connects with readers - or if it’s being overlooked. These numbers shed light on the effectiveness of your subject lines, sender names, and preheader texts in capturing attention, as well as how engaging your content is once the email is opened. Even with privacy features complicating precise tracking, these metrics provide a foundation for evaluating list health, revenue impact, and behavioral trends.
1. Open Rate
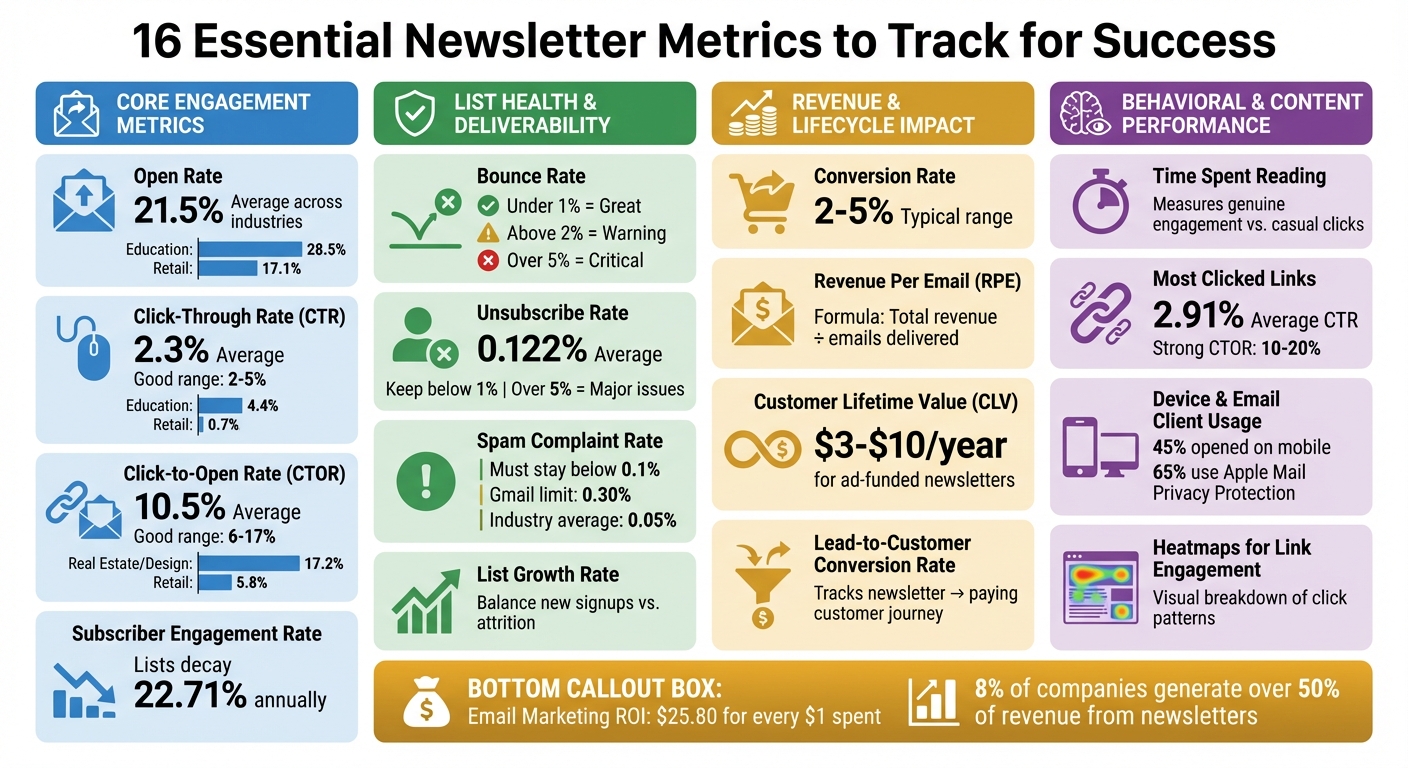
The open rate measures the percentage of subscribers who open your emails, offering a glimpse into how well your subject line, sender name, and preheader text resonate. Campaign Monitor's 2022 benchmarks show an average open rate of 21.5% across industries, with Education leading at 28.5% and Retail trailing at 17.1%.
That said, privacy features like Apple’s Mail Privacy Protection (MPP) have muddied the waters. With over 65% of email opens now linked to MPP, which automatically "opens" emails to safeguard user data, accuracy is a challenge. As Tom Kulzer, CEO of AWeber, points out:
Open rates measure nothing more than an image pixel being opened. That's all it's measuring. It is not measuring whether or not a human opened the email. It never has, it never will.
Still, open rates can highlight trends. For instance, Salesforce data shows average open rates climbing from 33.07% in 2023 to 36.24% in 2024. Sudden dips might signal deliverability issues, like emails landing in spam folders, which can harm your sender reputation. To improve open rates, experiment with subject lines that use personalization, questions, or urgency. Adding Brand Indicators for Message Identification (BIMI) to display your logo in the inbox can enhance credibility, while cleaning your list by removing subscribers who haven’t engaged in 3–6 months helps maintain a strong sender reputation.
2. Click-Through Rate (CTR)
CTR measures the percentage of recipients who click a link in your email. It’s calculated by dividing total or unique clicks by the number of delivered emails. According to 2021 data, the average CTR across industries was 2.3%, with Education leading at 4.4% and Retail lagging at 0.7%. A "good" CTR typically falls between 2% and 5%.
This metric reflects how relevant your content is and how effective your call-to-action (CTA) performs. It’s also a key tool in A/B testing, helping you identify which version of your email drives more clicks. However, be cautious - security tools and bots can inflate click data, particularly in B2B settings, where they account for over 60% of clicks. To increase CTR, segment your audience by demographics, interests, or past behaviors. Use clear, action-driven CTAs and consider adding interactive elements like polls or surveys to encourage engagement.
3. Click-to-Open Rate (CTOR)
CTOR measures the percentage of subscribers who, after opening your email, click on a link within it. It’s calculated by dividing unique clicks by unique opens. While CTR gives a broad view of engagement, CTOR zeroes in on how effective your content is for those who actually open the email.
In 2021, the average CTOR was 10.5%, with rates typically ranging from 6% to 17%. Industries like Real Estate, Design, and Construction achieved a CTOR of 17.2%, while Retail lagged at 5.8%. A high open rate paired with a low CTOR suggests your subject line grabs attention, but your content isn’t delivering. On the flip side, a low CTR but high CTOR might indicate strong content hindered by weak subject lines or deliverability issues. Angie, Operations Overseer at Cazoomi, explains:
CTOR is a better metric to track because it gauges interest... of the most relevant members of your audience: those who opened the email.
To improve CTOR, make your content easy to scan with clear headlines, brief paragraphs, and prominent CTAs. Adding a "P.S." section at the end of your emails to highlight secondary offers can also drive clicks.
4. Subscriber Engagement Rate
Tracking ongoing subscriber behavior is just as important as measuring immediate reactions. The subscriber engagement rate identifies active and inactive segments, offering insight into long-term loyalty trends. With email lists decaying by about 22.71% annually, monitoring engagement is crucial.
In 2023, HubSpot took a bold step by removing 250,000 unengaged users from its Marketing Blog list, reducing the subscriber count from 550,000 to 300,000. This move protected deliverability by avoiding "graymail". Keeping tabs on engagement can help you spot subscribers who might benefit from re-engagement campaigns before they go inactive. It also allows you to identify your most engaged readers, who should receive your most valuable content and offers. Regularly removing unengaged subscribers can prevent declining engagement from damaging your sender reputation.
To maintain strong engagement rates, consider auto-resend campaigns for subscribers who didn’t open the first email. Encourage direct replies by asking questions that invite responses - this not only boosts sender reputation but also builds stronger one-on-one connections. Finally, segment your list by engagement levels and tailor your email frequency accordingly. Highly active subscribers can handle more frequent emails, while less active ones may prefer fewer messages.
List Health And Deliverability Metrics
A well-maintained email list does more than just boost your numbers - it ensures your messages actually reach inboxes. Monitoring specific metrics like bounce rate, unsubscribe rate, spam complaints, and list growth gives you a clear picture of how healthy your list is and how effective your delivery practices are.
5. Bounce Rate
Bounce rate shows the percentage of emails that couldn’t be delivered and were returned to your server. There are two types: hard bounces, which are permanent failures due to invalid or closed email addresses, and soft bounces, caused by temporary issues like full inboxes or server errors. Internet Service Providers (ISPs) view high bounce rates as a sign of poor list maintenance, which can hurt your sender reputation. This might lead to your emails being flagged as spam or even blocked entirely.
Here’s what the numbers mean:
- Under 1%: Great shape
- Above 2%: A warning sign
- Over 5%: A critical issue to address immediately
Christy Saia-Owenby, CEO of MOXY Company, emphasizes:
"A bounce rate above 2 percent is concerning, and over 5 percent is problematic. Reduce it by using verified lists, authenticating domain records (SPF, DKIM, DMARC), and cleaning invalid addresses."
To keep your bounce rate low:
- Remove hard bounces right after sending.
- Deactivate addresses that soft bounce three times in a row.
- Use double opt-in during signups - it can cut hard bounces by up to 80%.
- Avoid purchasing email lists, as they often lead to high bounce rates and spam complaints.
6. Unsubscribe Rate
Unsubscribe rate measures the percentage of people opting out of your emails, offering insight into whether your content and targeting resonate with your audience. The average unsubscribe rate hovers around 0.122%, and experts advise keeping it below 1%. If a single campaign exceeds 0.25%, it’s a warning sign. Rates over 5% indicate deeper issues with your email design, frequency, or content value.
However, not all disengaged subscribers unsubscribe - some simply stop engaging, which is known as graymail. To minimize unsubscribes:
- Offer a preference center so subscribers can choose content types and email frequency.
- Use double opt-in to confirm interest at signup.
- Segment your list by interests to ensure relevance.
- Add a short survey on your unsubscribe page to gather feedback.
- Make your unsubscribe link easy to find to prevent recipients from flagging your emails as spam.
7. Spam Complaint Rate
Spam complaints are one of the most damaging metrics for your sender reputation. Providers like Gmail and Yahoo monitor these closely, with any rate above 0.1% (1 complaint per 1,000 emails) raising red flags. Starting February 2024, Gmail requires senders to keep spam complaint rates below 0.10%, with a hard limit of 0.30%. The industry average is around 0.05%.
Simon Data explains the root cause:
"Most spam complaints are generated because recipients don't recognize the email as coming from a sender they intentionally signed up to hear from."
To lower spam complaints:
- Use Gmail Postmaster Tools to monitor your domain.
- Implement double opt-in to ensure your audience is genuinely interested.
- Make the unsubscribe link easy to find, reducing the likelihood of recipients marking your emails as spam.
- Remove any email addresses that file a spam complaint right away.
- Stick to a consistent sending schedule to avoid catching subscribers off guard.
8. List Growth Rate
List growth rate measures how well your subscriber base is expanding, accounting for both new signups and attrition. It’s not just about adding names - it’s about building a list of engaged readers who actually interact with your content.
To grow effectively:
- Use optimized signup forms that include interest-based segmentation.
- Implement double opt-in to weed out bots and uninterested users.
- Identify where your most engaged subscribers come from - whether it’s webinars, content upgrades, or partnerships - and focus on those channels.
True growth isn’t about sheer numbers. It’s about attracting subscribers who open, click, and convert, ensuring your email efforts deliver real results.
Revenue And Lifecycle Impact Metrics
Engagement metrics tell you if people are opening and reading your emails. But when it comes to understanding how your emails contribute to your bottom line, revenue-focused metrics are where the real story unfolds. These four key metrics tie your newsletter efforts directly to financial outcomes, helping you see which campaigns drive sales, which subscribers are most valuable, and where your email strategy is truly making a difference.
9. Conversion Rate
The conversion rate shows the percentage of recipients who take a specific action after clicking through your email. This action could be anything from signing up for a demo to making a purchase. Generally, email marketing conversion rates fall between 2% and 5%.
Erica Santiago from HubSpot emphasizes its importance:
"Conversion rate is one of the most important metrics for determining how my emails achieve my goals."
A high click rate doesn't mean much if it doesn't lead to conversions. To track this effectively, integrate your email platform with web analytics and use unique tracking URLs (UTMs) for each campaign. You can also boost conversions by segmenting your audience based on past behavior, tailoring offers to match their interests, and testing different calls-to-action like "Shop Now" versus "Get the Deal". Adding elements like social proof, limited-time offers, and bonus content can also nudge subscribers toward taking action.
10. Revenue Per Email (RPE)
Revenue Per Email (RPE) measures how much revenue each email generates on average. The calculation is simple: divide the total revenue from a campaign by the number of emails delivered. This metric helps you identify which strategies are worth prioritizing. For instance, an email targeting a small VIP segment with a high-ticket offer might show a strong RPE, even if it doesn't reflect the overall performance of your entire list.
In July 2025, NBCUniversal’s streaming service Peacock sent out personalized "year-in-review" emails, showcasing viewing milestones. The results? A 20% reduction in churn over 30 days and a 6% increase in upgrades from free to paid subscriptions. Tracking RPE by segment and over time can uncover valuable trends. Regularly cleaning your email list also ensures inactive subscribers don’t drag down your RPE.
11. Customer Lifetime Value (CLV)
While RPE focuses on immediate returns, Customer Lifetime Value (CLV) looks at the bigger picture. CLV measures the total revenue a subscriber is expected to generate over their relationship with your business. For newsletters funded by advertising, this value typically ranges from $3 to $10 per year. You can calculate CLV by multiplying the average purchase value, purchase frequency, and customer lifespan.
Eliot Crist, CEO of Fantasy Life, highlights its importance:
"The best newsletters think about paid acquisition as an investment, not an expense. The goal isn't to acquire readers at the lowest cost - it's to bring in readers who will return value to your newsletter in the long run."
CLV is a critical guide for determining how much you can spend on acquiring new subscribers. It also helps you segment your audience, allowing you to give more personalized attention to subscribers with higher predicted lifetime value.
12. Lead-to-Customer Conversion Rate
This metric tracks how well your newsletter turns leads into paying customers. By measuring the percentage of subscribers who eventually convert, you can directly link your email efforts to revenue. It’s a bottom-of-the-funnel metric that requires integrating your email platform with a CRM to follow the journey from signup to purchase.
For example, between 2022 and 2025, marketplace app Mercari used targeted, personalized messaging to scale conversions. This strategy resulted in a 70% year-over-year growth in U.S. gross merchandise volume and helped the app reach 2 million monthly active users in the U.S. market.
If you notice high engagement but low conversion rates, it could signal a disconnect between your email content and the landing page experience. Make sure your emails set clear expectations about what happens after the click, and analyze which types of content generate the most qualified leads. That way, you can focus on creating more of what works.
Platforms like Breaker simplify this process by offering real-time performance analytics and CRM integrations, making it easier to connect your newsletter efforts to actual revenue outcomes.
sbb-itb-8889418
Behavioral And Content Performance Metrics
Behavioral metrics shed light on why some emails outperform others by revealing how subscribers interact with your content, what devices they use, and where their attention is focused. This data helps you craft newsletters that truly connect with your audience.
13. Time Spent Reading
Tracking how long subscribers spend reading your content can reveal the difference between a casual click and genuine engagement. Many email platforms only track the first six seconds of activity, so marketers often rely on "Time on Site" as an alternative measure of content consumption. This metric is especially useful for spotting "content disconnects." For instance, if an email generates a high number of clicks but low reading times, it likely means the content didn't live up to the expectations set by the subject line.
For long-form content, it's important to understand whether readers stick with the material or drop off partway through. To measure this effectively, use UTM codes in your email links and analyze "Time on Site" with tools like Google Analytics.
Dan Oshinsky, Founder of Inbox Collective, emphasizes this point:
"Time on site should give you a good sense of whether readers who click actually read your content."
Additionally, tracking which links hold readers' attention can guide layout improvements and better align your content with audience interests.
14. Most Clicked Links
Knowing which links attract the most clicks can tell you a lot about what resonates with your audience - whether it’s a specific topic, offer, or content format. This information is invaluable for refining your newsletter's structure and prioritizing elements that align with your business objectives.
For example, the average email click-through rate is roughly 2.91%, with a strong click-to-open rate falling between 10% and 20%. These benchmarks can help you gauge your performance. To dig deeper, use tracking URLs and visual click maps to identify which sections of your email are driving the most engagement. Including a "P.S." section is another effective way to boost clicks and engagement.
By understanding these patterns, you can fine-tune your email layout for better results.
15. Device And Email Client Usage
Knowing what devices and email clients your subscribers use is crucial for ensuring your emails look great and function properly. Nearly 45% of emails are opened on mobile devices like smartphones or tablets, making mobile-friendly designs a must. On top of that, as of November 2023, over 65% of emails are opened using Apple’s Mail Privacy Protection, which can inflate open rates and make tracking more challenging.
Technical details also play a big role. For example, Gmail clips emails larger than 102 KB, which can prevent tracking pixels from loading correctly. To avoid this, keep email file sizes under that limit, optimize subject lines for mobile viewing, and use descriptive alt text for images since many email clients block images by default. Tools like Gmail Postmaster can also help you monitor your domain's reputation and ensure smooth delivery.
16. Heatmaps For Link Engagement
Heatmaps offer a visual breakdown of where subscribers click within your emails. They go beyond simple click counts, showing which parts of your email layout grab attention and which areas might be ignored. This makes heatmaps especially useful when testing different layouts or rearranging content to guide readers toward your key goals.
By using heatmaps, you can identify the most engaging elements of your design and make adjustments to create a more intuitive reading experience. Platforms like Breaker provide real-time analytics, including detailed heatmap tracking, to help you understand subscriber behavior and fine-tune your newsletter for maximum impact.
These insights highlight the importance of leveraging detailed engagement data to make your email campaigns more effective.
How To Use These Metrics For Better Results
Simplify your analysis by grouping the 16 metrics into targeted dashboards. You can organize these dashboards by funnel stage - top-of-funnel (e.g., list growth rate and public reach), middle-of-funnel (e.g., CTR, CTOR, and sharing rates), and bottom-of-funnel (e.g., conversion rate, revenue per email, and lead-to-customer rate) - or by purpose to meet the unique needs of different teams. This setup helps you quickly identify what’s working and where you need to improve.
If you prefer a categorical approach, you might create dashboards focused on specific themes. For instance:
- Engagement metrics: Open rate, CTR, and time spent reading.
- List health: Bounce rate, spam complaints, and unsubscribe rate.
- Revenue indicators: RPE, CLV, and ROI.
- Behavioral insights: Device usage, heatmaps, and most clicked links.
This method works especially well when different teams need to focus on distinct priorities. For example, your content team might track engagement metrics daily, while your revenue team zeroes in on conversion rates and CLV during their weekly reviews. Tailored dashboards ensure that every team stays aligned with the metrics that matter most to their goals.
Consider your business stage when prioritizing metrics. Early-stage B2B companies, for example, should focus on engagement metrics like CTR and sharing rates to confirm content-market fit. On the other hand, established businesses may want to concentrate on revenue metrics, such as RPE and CLV. Keep in mind that email lists naturally shrink by about 22.71% each year, so maintaining list health is crucial.
To make this process seamless, platforms like Breaker offer advanced tools that integrate data into a single, real-time dashboard. This allows you to track everything in one place and receive alerts about issues like sudden spikes in bounce rates or unexpected changes in engagement. With this kind of automation, you can tweak your strategy on the fly instead of waiting for end-of-month reports.
Lastly, always use UTM parameters on your email links. These tags help you track the entire customer journey - from the moment they click your email to their final conversion. By connecting your email metrics to website behavior and sales outcomes, you’ll get a complete view of how your emails contribute to business results. Without this step, you’re likely missing a big part of the picture.
Conclusion
Tracking these 16 metrics can turn your newsletter into more than just a way to communicate - it becomes a powerful business tool. These numbers reveal what’s clicking with your audience, from the content they engage with to the subject lines that grab their attention, and even the calls-to-action that bring in revenue. Without this data, you're essentially flying blind, relying on guesswork instead of informed decisions.
The financial upside of this approach is hard to ignore. On average, email marketing delivers an ROI of $25.80 for every dollar spent. Even more striking, 8% of companies credit their newsletters with driving over half of their total revenue. Achieving these kinds of results isn’t luck - it’s the outcome of consistently tracking the right metrics and refining your strategy based on the insights they provide.
It’s also important to keep in mind that email lists naturally decline by about 25% each year. Monitoring growth and health metrics is crucial to maintaining a high-quality list. This also helps you stay compliant with deliverability standards, such as keeping spam complaints below 0.3% for providers like Gmail and Yahoo, ensuring your emails land in your audience’s inboxes.
To get started, focus on selecting at least one metric from each category - engagement, growth, monetization, and deliverability. This balanced approach ensures you’re looking at the big picture rather than fixating on just one aspect of performance. By analyzing multiple metrics together, you’ll uncover the full story behind your newsletter’s success.
Think of metrics as your roadmap. They guide decisions on everything from content and timing to segmentation and overall strategy. Tools like Breaker simplify this process, offering real-time dashboards that make it easy to identify problems and double down on what’s working. By committing to regular analysis and fine-tuning, your newsletter can evolve into a reliable driver of business growth.
FAQs
How can I increase my newsletter's open rate despite email privacy protections?
Boosting your newsletter's open rate in today’s privacy-conscious world means focusing on the factors that genuinely encourage readers to engage. Start by crafting subject lines that feel personal and intriguing - including the recipient’s name or company can make a big difference. Segment your audience to ensure emails are tailored to their industry, role, or interests, and use A/B testing to pinpoint the best times to send your messages. Also, make sure the sender name is familiar and trustworthy - using a real person’s name instead of just a brand often works better. And don’t forget: most people check emails on their phones, so mobile-friendly designs are a must.
Tools like Breaker make this process easier by offering features to personalize subject lines, segment audiences, and schedule sends effectively. Its real-time analytics focus on reliable engagement metrics, like clicks, so you can measure success even if open tracking is limited. Paired with a permission-based subscriber list and regular deliverability checks, these strategies can help you build authentic engagement - even in a world with stricter privacy protections.
How can I improve my newsletter's click-through rate?
Improving your newsletter's click-through rate (CTR) starts with aligning your content with what your audience wants. If your emails are getting opened but few people are clicking, it’s a sign that the email’s content or calls-to-action (CTAs) might not be hitting the mark. Stick to one clear, focused message that offers immediate value, and use short, action-driven CTAs to guide readers toward the next step.
Dive into your email performance data to see which links are getting the most attention. Position your top-performing links or CTAs near the top of the email to catch readers’ eyes right away. Make CTAs stand out by using bold, button-style designs that are easy to notice and tap - especially on mobile devices. Take advantage of real-time analytics to test subject lines, preview text, and CTAs. Use the insights to tweak and improve as you go. This ongoing process of testing and refining will help you steadily boost your CTR.
Why is it important to track Customer Lifetime Value (CLV) for newsletters?
Understanding Customer Lifetime Value (CLV) is key to grasping how much revenue a subscriber is expected to bring in throughout their time with your newsletter. This metric gives clarity on whether your acquisition costs are paying off and highlights which audiences are worth your attention and resources.
Focusing on CLV enables you to make informed marketing decisions, allocate your budget more effectively, and evaluate the long-term success and profitability of your newsletter. It’s an essential tool for driving sustainable growth and maximizing your return on investment (ROI).