Market Analysis Template: How to Build One for B2B Growth
Most advice about a market analysis template gets the order backward. Teams are told to start with a polished document, fill every box, and then “derive strategy,” which is exactly how you end up with a pretty file nobody opens after kickoff. A better template starts with the decision, then forces the market evidence to justify it.
That matters even more for B2B newsletter operators. You don't need a report that describes the market in abstract terms, you need one that tells you which segment to grow next, which sponsor angle is credible, which competitor you should position against, and which content pillar deserves the next campaign cycle. A market analysis template built for that job becomes a working asset, not a presentation artifact.
Why Most Market Analysis Templates Sit in Drive and Collect Dust
A market analysis template looks finished long before it does any useful work. Teams spend time filling every field, polishing the language, and making the file feel complete, then no one can explain what decision it was supposed to shape. Consultant-style frameworks usually do better on structure. They start by defining the market in one sentence and sizing it with TAM, SAM, and SOM so assumptions, sources, and boundaries stay visible for review across industries. The problem appears when that structure is not tied to a real choice.
For newsletter growth work, that failure shows up quickly.
- No ICP decision attached: The analysis names markets, but does not tell sales, content, or partnerships who gets priority.
- No owner or revisit date: The file is complete on day one and irrelevant by next month.
- No campaign implication: The team cannot turn segments into lists, sponsors, or editorial bets.
Practical rule: If a section does not end in a decision, a segment, or a campaign action, it is probably filler.
The stronger templates force harder habits. They ask teams to fill sections with sourced data, date every figure, and name where each number came from, which is what makes the output useful later on. If you want a simple example of how format choices shape adoption, Slideworks shows the kind of market-framing structure that keeps assumptions readable, while the market analysis template from Market Intelligence Tools reflects the same bias toward visible inputs and traceable notes. That discipline keeps a market analysis template from turning into a branding exercise.
For newsletter operators, the better test is narrower. Each section should answer one of four questions, which audience do we target first, which competitor do we frame against, which sponsor story is believable, and which content pillar gives us the best shot at growth. A useful analysis also has to survive the sales pitch inside the company, which is why the framing in how to sell an idea matters here. A market analysis without a decision owner is just a pile of charts.
If the template is going to be customized, the structure should fit the way the team works. That is where customizing templates in Webtwizz becomes more practical than a generic worksheet, because the sections can reflect the decisions a newsletter team makes week to week instead of forcing a polished report no one reuses.
Setting Up Your Template With the Right Foundation
A usable template starts before the first data field. First, define the business question in one sentence, not three paragraphs. For a newsletter operator, that might be, “Which B2B segments should we target with our newsletter in the next two quarters?” That sentence becomes the filter for every later choice, from research sources to segment scoring.
Write a one-page analysis brief first
The most useful front page is not a summary, it's an analysis brief. Include the decision the analysis must support, the audience for the document, the owner for each section, the deadline, and the time horizon. That keeps the template from drifting into a research dump.
Then define the newsletter ICP separately from the company ICP if they're not identical. A newsletter can serve a narrower buyer profile than the broader business, especially when the goal is to drive engaged subscribers rather than generic reach. If the brief can't answer who the newsletter is for, the rest of the template won't hold together.
A good setup also separates primary data from secondary data. Primary inputs usually come from CRM exports, win-loss notes, support tickets, and surveys, while secondary inputs come from published market material and competitor observation. That split matters because the template should force you to know which conclusions come from your own funnel and which come from the market.
For teams that customize templates across tools, the principle is the same as in customizing templates in Webtwizz, use the structure as a base, then tune the fields to the actual decision. A generic template is easy to copy, but a decision-focused one is the only version worth maintaining.
Keep the first page brutally short. If the brief is hard to scan, the rest of the document will get skipped.
The practical outcome is a template with two speeds. Some sections should be dense and quantified, like sizing and competitive pressure. Others should be light and directional, like the summary of the business decision. That balance is what makes the analysis readable to operators who need action, not just context.
If you want a companion prompt for audience definition, how to define target audience helps pressure-test the ICP before the template fills up with loose assumptions.
Sizing the Market With TAM, SAM, and SOM
TAM, SAM, and SOM only matter when they map to what the newsletter can capture. In B2B newsletter terms, TAM is every plausible subscriber or buyer in the universe, SAM is the reachable subset by channel and ICP fit, and SOM is the portion you can realistically win inside the planning window. That same sizing logic shows up in standard market sizing frameworks, but the useful version is the one that changes a list target, a sponsor pitch, or a segment priority, not the one that sits in a deck and gets ignored.
Use top-down and bottom-up together
Top-down sizing starts with the largest credible market boundary, then narrows it. Bottom-up sizing starts with the reachable list, expected engagement, and realistic conversion or sponsorship yield. The template should make both paths visible, because relying on only one direction usually inflates the opportunity.
A simple newsletter example works like this. Start with a TAM of all B2B marketers who could plausibly subscribe. Narrow to a SAM of the subset you can reach through your channels, geography, and topic fit. Then estimate SOM from the list growth you can sustain, factoring in engagement quality and campaign capacity. The numbers themselves have to come from your own evidence base, but the structure stays stable.
| Metric | Definition | Worked Example | Formula |
|---|---|---|---|
| TAM | Total addressable universe | All plausible B2B newsletter subscribers in the category | Broad market definition |
| SAM | Reachable subset | Subscribers reachable through your channels and ICP fit | TAM narrowed by channel and fit |
| SOM | Obtainable share | Realistic audience you can win in the planning window | SAM narrowed by execution capacity |
The triangulation standard is what keeps the estimate credible. Stronger templates ask for at least two published sources for TAM, a bottom-up SAM built from reachable customers times spend or contract value, and clear confidence tags so reviewers can separate sourced facts from inferred estimates. The same guidance also warns against broad demographic segmentation alone, because buying trigger and use case usually predict conversion better than age or company size. For a practical planning pass, I often pair this sizing section with a business case template so the market math points to a specific budget ask or growth decision.
The input quality matters just as much. A template that dates each figure and records the source makes it obvious what needs refreshing later and what can stay stable for a quarter or two. That is especially useful for newsletter operators, because subscriber potential changes more slowly than campaign performance.
For persona detail that feeds the bottom-up side of the model, the SaaS buyer persona guide is useful because it keeps the sizing work tied to a real reader profile, not a generic industry label.
Mapping Segments, Personas, and Competitors Together
Segmentation gets much stronger when it's not treated as a separate worksheet. The highest-value version groups buyers by buying trigger, use case, or problem, then maps a single persona and a small competitor set to each priority segment. That approach lines up with modern competitive analysis, which distinguishes direct, indirect, and aspirational rivals and treats them differently in strategy (Semrush).
Build segment cells around behavior, not demographics
A segment like “Series B SaaS growth lead” is useful because it implies urgency, budget pressure, and a specific editorial appetite. A broader label like “SaaS marketer” is too soft to guide content or sponsorship decisions. The segment definition should make it obvious why this group subscribes, why it opens, and what topic angle earns attention.
Then attach one persona per priority segment. The persona doesn't need a novel, it needs the details that affect message choice, sponsor relevance, and newsletter cadence. For a growth lead, that could mean a CMO or VP Growth who reads competitor newsletters, reacts to board pressure, and cares about pipeline, not vanity metrics.
A practical way to score the matrix is to use a 1–5 scale for two dimensions, segment attractiveness and competitive pressure. High attractiveness and manageable pressure deserve focus, while low attractiveness and heavy pressure usually don't. The point isn't to build an academic model, it's to decide where next quarter's list growth should concentrate.
Useful shortcut: Segment by what changes buying behavior, not by what looks tidy in a spreadsheet.
For persona work, a SaaS buyer persona guide can help teams keep the profile grounded in purchase context rather than generic role descriptions. That matters because newsletter operators often confuse “interesting audience” with “audience likely to engage, convert, and sponsor well.”
The competitive side should stay tight. One direct competitor shows what the segment already consumes, one indirect competitor shows what else steals attention, and one aspirational competitor shows where the bar is going. If the newsletter is trying to own AI-assisted growth content, the aspirational brand might be the one setting the pace on clarity, distribution, or authority, even if it's not in the exact same niche.
The best output is a quadrant that says, in plain terms, which segments deserve list growth, which deserve a separate positioning test, and which should be deprioritized. That is much more useful than a long competitor appendix no one turns into an editorial plan.
Working Through Pricing, Distribution, and Trend Gaps
This is the middle of the template where analysis becomes operational. Pricing, distribution, and trend gaps should sit together because they shape the same question, where is the market willing to pay attention, and where can the newsletter show up with impact? A product pricing framework for SMBs can be a helpful analogy here, because pricing only works when it matches value, channel, and audience fit, not just internal preference (Data Hunters Agency).
Benchmark what the audience will actually pay attention to
For newsletter operators, pricing usually means sponsorship value, paid placement potential, or the economics of a premium audience. Instead of inventing a single “market price,” build a small benchmark table with audience size, ICP specificity, and placement type. That gives sponsors something concrete to react to and keeps your pitch from sounding hand-wavy.
The next block is distribution. Score organic, paid, and earned channels separately. Organic might include SEO, LinkedIn, and partnerships. Paid might include sponsorship swaps or paid acquisition. Earned might include referrals, third-party mentions, and credibility borrowed from other operators. The best channel mix depends on whether the newsletter wins on authority, speed, or niche precision.
A trend-gap review closes the loop. Look for commercially useful white space by connecting underserved segments to fast-moving signals such as import-export shifts, geographic concentration, or supply-chain disruption. Recent guidance on underserved market angles argues that high-growth product categories with low domestic production can reveal useful gaps, and that trend-gap analysis plus price-feature mapping can expose zones competitors miss (IndexBox). That's exactly the kind of angle newsletter operators can turn into a sponsor story or a content pillar.
A useful working example is an AI-enrichment trend. If buyers in a niche are suddenly talking about data hygiene, enrichment, and workflow automation, the newsletter can reposition around that language and attract a sponsor vertical aligned with the shift. The win comes from matching a visible market change to a content theme sponsors already want to buy.
Use this checklist in the template:
- Pricing benchmarks: List the sponsorship or placement pattern by audience type and relevance.
- Channel scoring: Rank organic, paid, and earned by fit, effort, and repeatability.
- Trend signals: Record the most relevant demand shifts, then note the business consequence.
- Gap test: Ask whether the whitespace is large enough, timely enough, and specific enough to act on.
That last question is the key filter. Many “opportunities” are interesting but not commercial. A market analysis template for growth only earns its keep when it separates attention-grabbing trends from usable ones.
Turning Your SWOT Into Newsletter Growth Plays
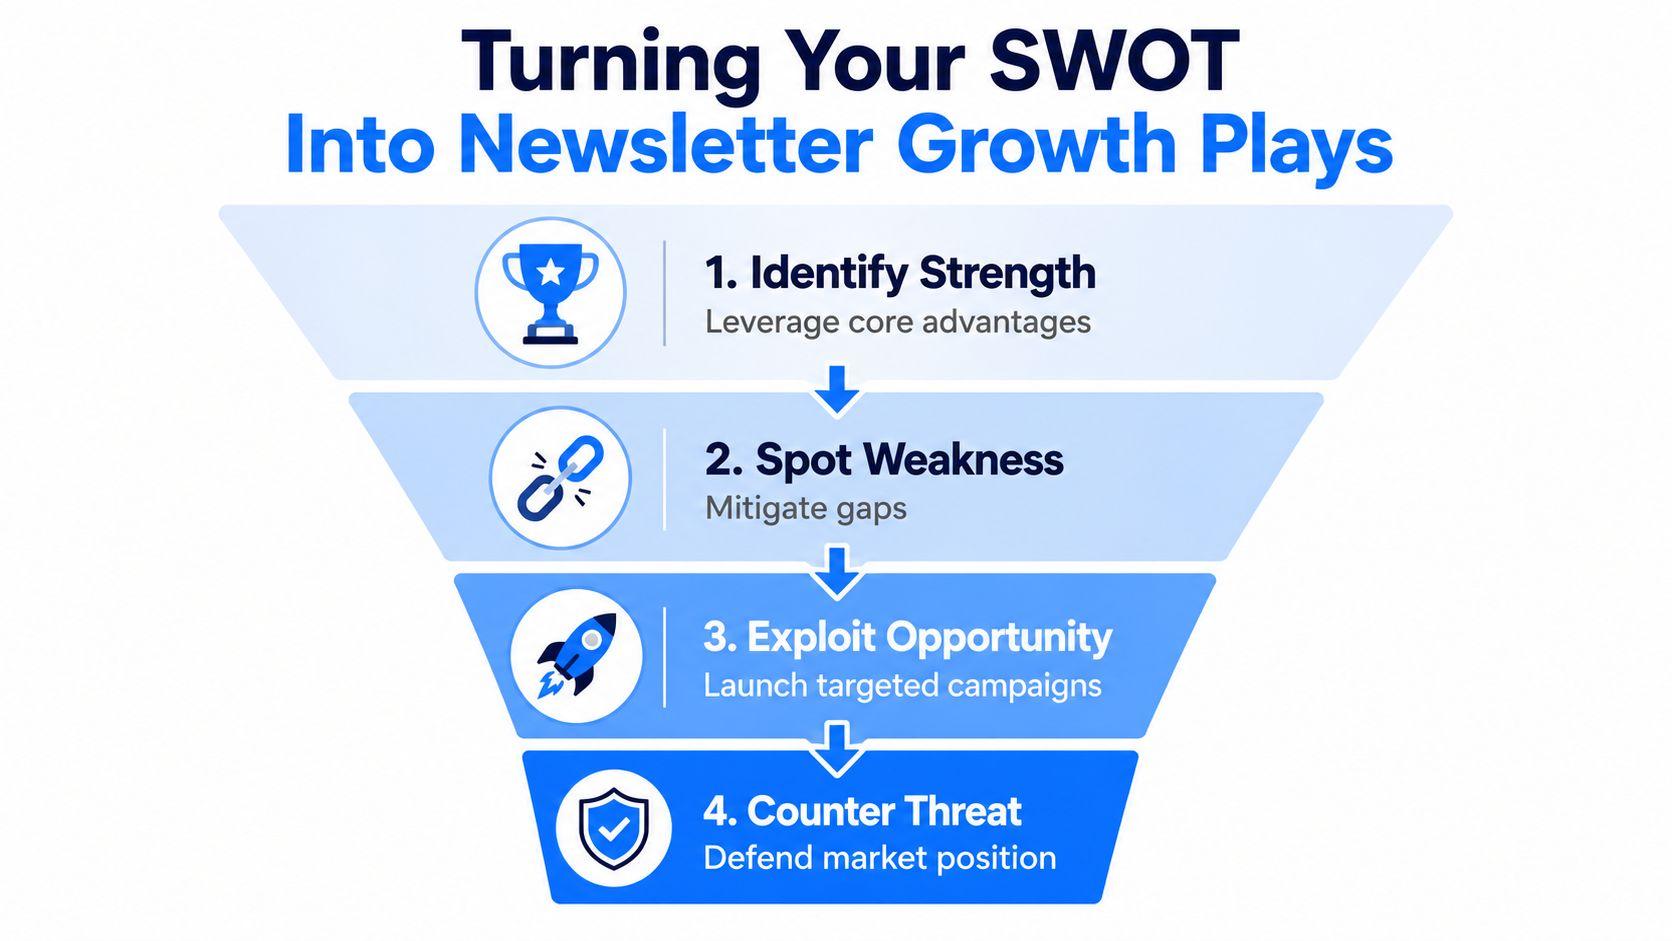
SWOT becomes useful only when every row maps to a move. A polished SWOT with no campaign output is just a summary of opinions. A working SWOT turns into content pillars, list growth plays, and sponsor angles that fit the next operating cycle.
Convert each quadrant into a tactic
A strength should become a content pillar or a proof point in the media kit. If the newsletter has unusually strong operator access, that can support a recurring interview format or a sponsor package built around credibility.
A weakness should become a build decision. If technical depth is thin, the fix is not to hide it, it's to create a deep-dive series, recruit a subject-matter voice, or narrow the editorial angle so the weakness stops hurting conversion.
An opportunity should become a targeted play. If a niche vertical is heating up, the template should trigger a list enrichment sequence, a sponsor outreach batch, or a segmented launch issue. A threat should become a positioning test in the next issue, not a note to worry about later.
If a SWOT row can't be translated into an email send, a list action, or a sponsor pitch, it's probably too vague to matter.
This is also where the earlier segment work pays off. A threat from a new AI newsletter doesn't need a generic response. It needs a defined counter-move against the segment where overlap is highest, with the content angle, CTA, or sponsor proof point adjusted accordingly.
The cleanest way to keep the analysis from going stale is to feed the findings back into targeting and analytics. That means tracking whether the new segment hypothesis affects opens, clicks, and subscriber growth, then refreshing the SWOT only when those signals or the competitive environment change. The template should feel like an operating tool, not a quarterly ceremony.
Operating Cadence, Metrics, and Mistakes to Avoid
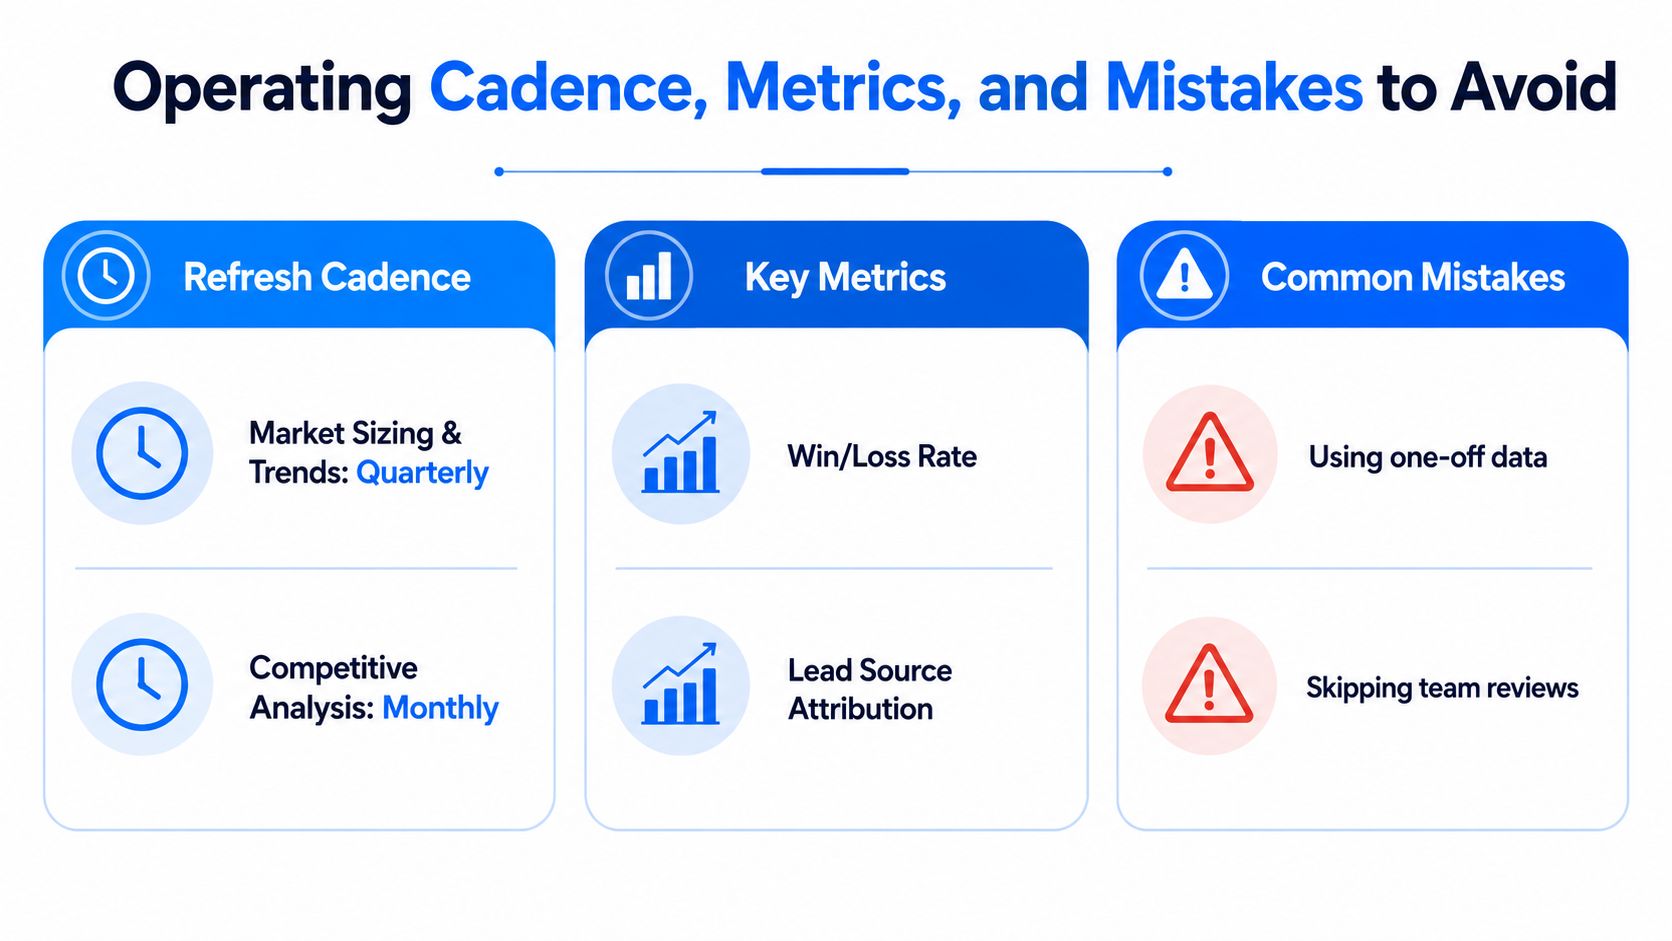
A market analysis template only earns its keep when the team returns to it. For B2B newsletter operators, the cadence should match how fast decisions change. Review market sizing and trend inputs quarterly, then update competitor moves monthly. That keeps the template tied to current state metrics instead of stale commentary, and it gives every update a clear job in the workflow.
Track metrics that prove the analysis changed behavior
The analysis is useful only if it changes who gets targeted and how attention gets monetized. The clearest signals are new engaged subscriber rate, sponsor revenue per issue, click-to-open on priority segments, and ICP share of the list. Those four metrics show whether the template is improving audience quality, commercial value, and segment fit. If those numbers do not move, the document is probably producing commentary instead of decisions.
Watch for the mistakes that kill adoption
The first mistake is relying on one data source and treating the job as finished. The second is producing a report that never changes a campaign, a list action, or a sponsor conversation. The third is letting the document drift away from the send calendar, so the strategy and the actual newsletter output stop matching. The fourth is treating TAM like the headline and SOM like an afterthought.
- Using one-off data: Build a refresh routine for the sections that change fastest.
- Skipping team reviews: Let growth, editorial, and sponsorship owners challenge assumptions before the next send.
- Defaulting to broad segments: Keep segmentation tied to buying triggers and actual use cases.
- Stopping at insight: Push every major finding into an email, a list action, or a pitch.
The best operating habit is plain and repetitive. Each month, review competitor movement and campaign response. Each quarter, revisit sizing, trends, and segment priority. When the market shifts, update the template before the next campaign cycle starts, not after the damage shows up in performance.
A market analysis template does not need to become a book. It needs to become the place your team checks before making the next growth bet.