A Complete Guide to Email Campaign Performance Metrics

Email campaign performance metrics are the numbers that tell you exactly how your audience is responding to your emails. Think of metrics like open rates, click-through rates, and conversion rates as the story behind your sends—showing you what’s hitting the mark and what’s falling flat.
These numbers aren't just data points; they're your roadmap for growth.
Why Email Performance Metrics Matter More Than Ever
In B2B marketing, hitting "send" is only the first step. The real work begins when you start digging into the results. Understanding your email campaign metrics is what separates blindly shooting emails into the void from building a predictable engine for revenue.
Think of it like this: launching a campaign without tracking metrics is like driving a car with the dashboard covered. You feel the car moving, but you have no clue how fast you’re going, how much gas is in the tank, or if the engine is about to overheat. Performance metrics are your gauges, giving you the critical feedback needed to get where you're going.
Connect Your Efforts to Business Outcomes
Tracking metrics isn’t about hoarding data for the sake of it. The real goal is to use that data to ask smarter questions and make better decisions. When you look past the surface-level numbers, you can start drawing a straight line from your email campaigns to real business results.
For example, email marketing consistently delivers a massive return on investment. Businesses often see a return of $36 to $45 for every dollar spent, which works out to an average ROI of over 3600%. But there's a catch: a shocking 50% of marketers admit they do a poor job of measuring this ROI, or don't measure it at all. This means huge potential is being left on the table. You can dive deeper into these numbers by exploring the latest findings on email ROI in 2026.
This measurement gap is a massive opportunity. A data-driven approach helps you:
- Justify your marketing budget by proving the direct financial impact of your campaigns.
- Create better content by seeing what actually resonates with your audience.
- Improve list health and deliverability by keeping a close eye on subscriber behavior.
When you master your email analytics, you're not just reporting on past performance. You're actively shaping the future success of your entire marketing program. Every metric is a clue that helps you refine your strategy and drive real growth.
Ultimately, these metrics are the lifeblood of any good email strategy. They give you the insights to turn your analytics into a clear plan, transforming your newsletter from a simple communication tool into one of your business's most valuable assets.
Before we dive into the nitty-gritty of each metric, here's a quick overview of the key players you'll want to keep an eye on. This table gives you a snapshot of what each one measures and why it's so important for understanding your campaign's health.
Key Email Performance Metrics at a Glance
| Metric | What It Measures | Why It Matters |
|---|---|---|
| Deliverability Rate | The percentage of emails that successfully reached subscribers' inboxes. | It’s the foundation. If your emails aren’t getting delivered, nothing else matters. |
| Open Rate | The percentage of subscribers who opened your email. | Shows the effectiveness of your subject line, sender name, and brand recognition. |
| Click-Through Rate (CTR) | The percentage of subscribers who clicked a link in your email. | Indicates how compelling and relevant your email content and call-to-action are. |
| Conversion Rate | The percentage of subscribers who took a desired action after clicking. | Connects your email efforts directly to business goals like sales or sign-ups. |
| Unsubscribe Rate | The percentage of subscribers who opted out after receiving your email. | Helps you gauge audience satisfaction and identify potential content or frequency issues. |
This table is a great starting point, but the real magic happens when you understand how these metrics work together. Now, let's break down each one so you can start using them to make smarter decisions.
The Core Four Engagement Metrics You Must Track
It’s easy to get lost in a sea of email analytics. But when you cut through the noise, only a handful of metrics truly tell you if your campaigns are working. Forget the vanity stats and focus on what I call the “Core Four.”
These are the numbers that tell a complete story, from grabbing attention to driving real business results. Mastering the Open Rate, Click-Through Rate, Click-to-Open Rate, and Conversion Rate is the first step to turning your newsletter into a strategic asset, not just another broadcast.
This flow from raw data to smart decisions and, ultimately, real growth is what it’s all about.
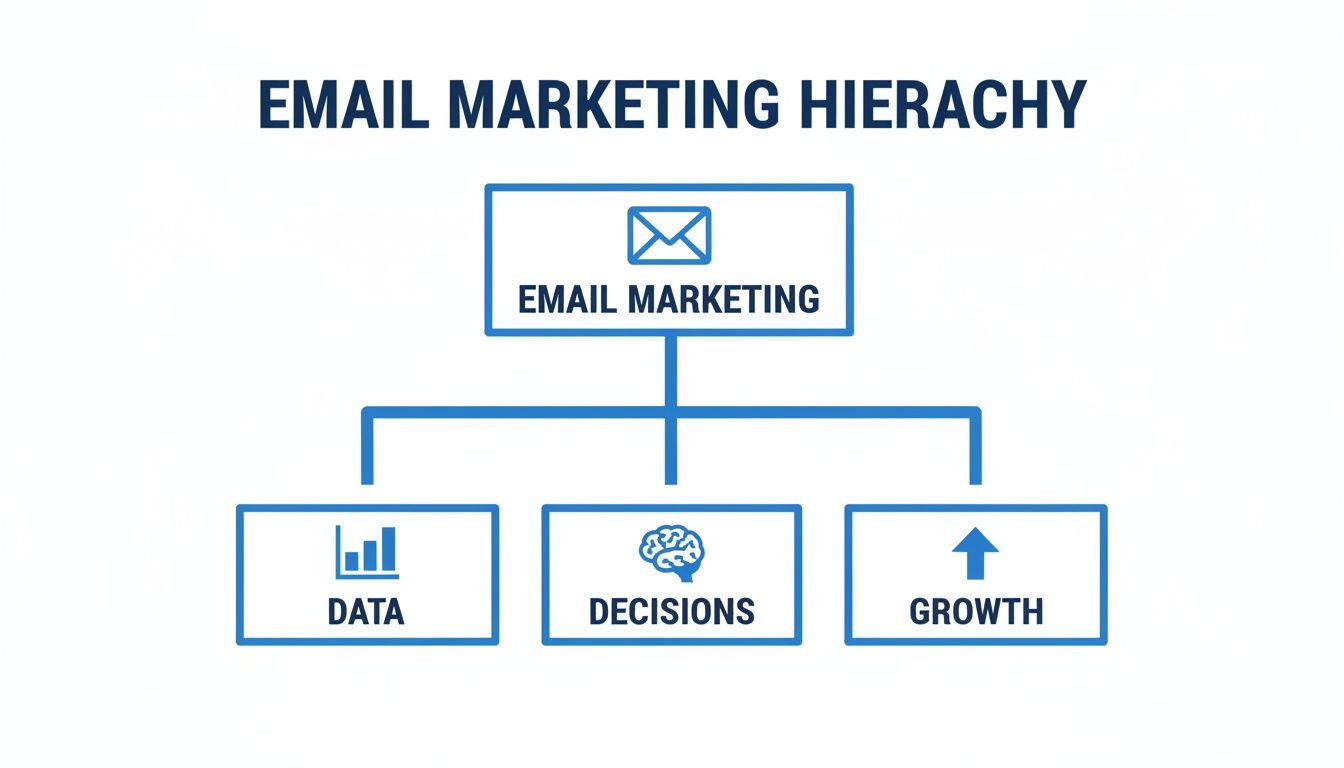
Let's break down each of these essential metrics.
1. Open Rate: The Evolving First Impression
Your open rate is simply the percentage of subscribers who opened your email. Think of it as the first handshake—a quick test of how well your sender name, subject line, and preview text grabbed your audience's attention. To get this right, you absolutely need to follow email subject line best practices to boost open rates.
But there’s a catch. The reliability of this metric has taken a hit recently. Thanks to features like Apple’s Mail Privacy Protection, which can pre-fetch and auto-open emails, the numbers are often inflated. The industry average now floats somewhere between 21% and 42.35%, a massive range skewed by these privacy features.
Today’s Takeaway: Don’t obsess over your open rate as an absolute truth. Instead, use it as a directional guide. It's perfect for comparing the relative performance of subject lines from one campaign to the next, but it’s no longer a perfect measure of individual engagement.
2. Click-Through Rate: The True Test of Relevance
The Click-Through Rate (CTR) is where the rubber meets the road. It measures the percentage of your total recipients who clicked on at least one link. An open signals curiosity, but a click shows genuine interest in what you have to say.
- Formula: (Total Clicks ÷ Total Delivered Emails) × 100
- What it tells you: How effective your email copy, design, and call-to-action (CTA) were at getting someone to take the next step.
- B2B Benchmark: For a B2B newsletter, a good CTR usually lands between 2% and 5%.
If you have a high open rate but a low CTR, that’s a red flag. It’s a clear sign your subject line wrote a check that your email content couldn't cash. For a deeper look at this critical metric, you can check out our glossary entry on click-through rate.
3. Click-to-Open Rate: Your Diagnostic Tool
The Click-to-Open Rate (CTOR) is your secret weapon for diagnosing content problems. It measures the percentage of people who opened your email and then clicked a link. By ignoring everyone who didn’t open the email, CTOR gives you a much cleaner look at how well your content actually performed.
- Formula: (Unique Clicks ÷ Unique Opens) × 100
- What it tells you: How well your message resonated with the audience you successfully hooked with your subject line.
- B2B Benchmark: A healthy B2B CTOR is typically between 20% and 30%.
Think of CTOR as your go-to diagnostic tool. If you have a solid open rate but a terrible CTOR, the problem isn’t your subject line—it's your email’s body copy, its design, or your CTA. Breaker’s analytics make it simple to monitor CTOR, helping you pinpoint exactly where you need to focus, whether that’s rewriting your offer or just making your button bigger and bolder.
4. Conversion Rate: The Bottom-Line Metric
Finally, we get to the metric that actually pays the bills: the Conversion Rate. This is the percentage of people who clicked a link and then completed the specific action you wanted them to take—like signing up for a demo, downloading a guide, or making a purchase.
This is the ultimate measure of your email’s success. While opens and clicks are important leading indicators, conversions are what generate revenue and prove your email program’s ROI. To track this, you'll need to connect your email platform to your website analytics (usually with UTM parameters) to follow the user’s journey after they click.
Understanding Your List Health and Deliverability
You can have the most brilliant content and a game-changing offer, but none of it matters if your emails get sent straight to the spam folder. Engagement metrics tell you what happens after someone opens your email, but list health and deliverability metrics decide if you even make it to the inbox.
Think of these numbers as the foundation of your entire email strategy. Without a healthy list and a solid sender reputation, you’re building on shaky ground. Getting this right is the first, most critical step.

Unsubscribe Rate
The Unsubscribe Rate is simply the percentage of people who choose to opt out of your emails. It can feel a little deflating to see people leave, but don't panic—it's actually a good thing. A healthy unsubscribe rate means your list is self-cleaning.
In fact, a rate of zero can be a warning sign. It might mean your unsubscribe link is buried, or worse, that your audience is so disengaged they don't even bother to click it. They just delete your emails, which is far more damaging in the long run.
- Formula: (Total Unsubscribes ÷ Total Delivered Emails) × 100
- B2B Benchmark: A healthy unsubscribe rate is anything below 0.5%. If you see a sudden jump, take a look at your recent content or sending frequency.
Making it easy for uninterested folks to leave keeps your list full of people who actually want to hear from you, which naturally boosts your other engagement metrics.
Bounce Rate
Your Bounce Rate is the percentage of emails that failed to reach an inbox. This is a direct reflection of your list quality, and it’s crucial to know there are two different kinds of bounces.
- Hard Bounces: These are permanent failures. The email address is fake, invalid, or simply doesn't exist anymore. It’s like sending a letter to an address that was bulldozed.
- Soft Bounces: These are temporary issues. Maybe the recipient's inbox is full, their server is down, or your email file is too big. The address is valid, but the delivery failed for a reason that might resolve itself.
A high hard bounce rate is a massive red flag for Internet Service Providers (ISPs). It signals that you have a low-quality or old list. If your hard bounce rate stays above 2%, you risk serious damage to your sender reputation, and your emails will start getting flagged as spam.
This is where automation becomes a lifesaver. Breaker’s TruSend deliverability management automatically scrubs your list of hard-bouncing addresses, protecting your sender score without you having to lift a finger.
Spam Complaint Rate
The Spam Complaint Rate tracks the percentage of people who actively mark your email as spam. This is, without a doubt, the single most destructive metric for your sender reputation. Even a handful of complaints can do major damage.
Unlike an unsubscribe, a spam complaint is a direct signal to providers like Gmail and Outlook that your content is unwelcome. Get too many of these, and your future campaigns will be sent directly to the spam folder or blocked entirely. If you want to dive deeper into protecting your sender reputation, it’s worth reviewing these core email deliverability best practices.
- Formula: (Total Spam Complaints ÷ Total Delivered Emails) × 100
- Industry Standard: Your goal should be to keep this number below 0.1%. That’s just one complaint for every 1,000 emails you send.
To keep this number in check, always use a clear opt-in process, never buy email lists, and make your unsubscribe link impossible to miss. If someone wants to go, you want them to click "unsubscribe," not "report spam."
Advanced Metrics for Measuring Growth and ROI
Engagement numbers like open and click-through rates are important, but they only tell part of the story. To really prove your email program is pulling its weight, you have to connect your campaigns directly to business growth and revenue.
That’s where you need to look beyond opens and clicks and start tracking metrics tied directly to growth and ROI. Mastering these numbers shifts the conversation from “Did they open it?” to “Did it grow our audience and make us money?” It’s how you demonstrate real financial impact and make a strong case for more budget.
Subscriber Growth Rate
Your Subscriber Growth Rate is the pulse of your email list. It tells you exactly how fast your audience is expanding over a set period. A healthy, positive growth rate is a clear sign that your lead magnets and acquisition efforts are hitting the mark.
Calculating it is pretty simple:
- Formula: (([New Subscribers] - [Unsubscribes + Spam Complaints]) ÷ [Starting List Size]) × 100
Let’s say you started the month with 10,000 subscribers. You brought in 800 new ones, but lost 150 to unsubscribes and spam complaints. Your net gain is 650 subscribers.
- Example Calculation: ((800 - 150) ÷ 10,000) × 100 = 6.5% Growth Rate
The goal is a consistently positive number. If your growth rate flattens out or goes negative, it’s a red flag telling you it's time to rethink your list-building strategies. Breaker helps turn this process into a predictable engine by delivering a steady stream of engaged, exact-match subscribers who fit your ideal customer profile.
List Churn Rate
While growth rate tracks who’s coming in, your List Churn Rate (also called attrition) measures who’s heading for the door. Keeping churn low is just as critical as acquiring new subscribers—after all, there’s no point pouring water into a leaky bucket.
- Formula: ([Total Subscribers Lost] ÷ [Starting List Size]) × 100
Using our last example, you lost 150 subscribers from a list of 10,000.
- Example Calculation: (150 ÷ 10,000) × 100 = 1.5% Churn Rate
A low churn rate signals that your audience is happy and your content is relevant. If you see this number creeping up, it could point to problems with email frequency, content quality, or a mismatch between what you promised at sign-up and what you’re delivering.
Email Marketing ROI
This is the big one. Return on Investment (ROI) is the bottom-line metric that answers the most important question for any stakeholder: "For every dollar we put into email marketing, how much revenue are we getting back?"
To figure this out, you need to track both your total investment and the revenue you can directly attribute to your email campaigns.
ROI Formula: (([Revenue from Email] - [Total Email Marketing Cost]) ÷ [Total Email Marketing Cost]) × 100
For example, if your campaign brought in $5,000 in sales and your total costs—platform fees, content creation, and so on—were $500, your ROI would be a whopping 900%. That means you earned $9 for every $1 you spent.
To accurately track traffic and attribute revenue from your emails, you need a solid tracking system. This is where tools like Google Analytics UTM parameters become absolutely essential.
If you want to go deeper, our guide on how to calculate email campaign ROI provides a complete breakdown with more examples.
Customer Lifetime Value (CLV)
Customer Lifetime Value (CLV) is a more advanced, forward-looking metric that projects the total revenue you can expect from a single customer over their entire relationship with your business. While it’s not exclusively an email metric, your email program has a huge influence on it.
By sending valuable content, personalized offers, and timely communications, your email marketing efforts directly contribute to:
- Increasing purchase frequency
- Boosting average order value
- Improving customer retention and loyalty
When you start tracking how email engagement correlates with your high-CLV customers, you can see the long-term financial impact of your program. This allows you to segment your most valuable customers, analyze their email behavior, and find ways to replicate that success across your entire list—turning one-time buyers into lifelong fans.
Building Your Email Performance Dashboard
Raw numbers are just noise. Your email campaign metrics only become useful when you can see them clearly and act on them. This is where a good dashboard comes in—it’s not about building complex charts, but about turning a flood of data into a clear story.
Think of your dashboard as a command center for your email strategy. It should give everyone, from the marketer running the campaign to the executive reviewing the results, a quick, accurate snapshot of what’s working, what’s not, and where to focus your energy next.

Organizing Your Dashboard by Cadence
The secret to a dashboard that people actually use is organizing it by how often you need to check in. Different people need different levels of detail, so grouping your KPIs by daily, weekly, and monthly views keeps everyone informed without feeling overwhelmed.
This approach makes it much easier to spot problems, see trends as they emerge, and use real data to drive your next move.
Daily Checks: The Immediate Health Scan
Think of your daily metrics as the vital signs you check right after hitting "send." These numbers give you an immediate read on the technical health of your campaign, letting you catch any big problems before they spiral.
- Deliverability & Bounce Rate: Did the email actually land in inboxes? A sudden spike in hard bounces might point to a bad list segment that you need to fix right away.
- Unsubscribe Rate: A few people opting out is normal. A flood of unsubscribes in the first few hours is a clear sign your message completely missed the mark with a certain group.
- Spam Complaint Rate: This is the metric that needs your immediate attention. Even a handful of spam complaints can damage your sender reputation, so you have to investigate this fast.
Weekly Reviews: The Engagement Pulse
After the first 24-48 hours, the initial flurry of activity dies down and you can start to see how your audience really felt about the email. Your weekly check-in is all about understanding engagement and figuring out what to do for your next campaign.
A weekly review is where you shift from just monitoring to real analysis. It’s your chance to ask why—why did this subject line work so much better than last week’s? Why did one CTA get all the clicks? These are the insights that make your entire email program smarter.
Your weekly dashboard should zero in on:
- Open Rate & Click-Through Rate (CTR): How does this campaign stack up against previous ones? Start looking for patterns.
- Click-to-Open Rate (CTOR): This is your best signal for content quality. Is your CTOR trending up over time?
- Conversions (by leading indicators): Are people clicking on your most important CTAs, like "Request a Demo" or "Download Ebook"? This tells you which offers are actually compelling.
The Breaker analytics dashboard is designed to give you a clean, at-a-glance view of these core engagement metrics for every campaign.
Visualizing the data this way makes it easy to see the relationship between your opens, clicks, and subscriber growth, helping you connect the dots between your campaigns and overall list health.
Monthly & Quarterly Reporting: The Big Picture
Monthly and quarterly reports are for leadership and high-level strategy. This is where you zoom out to show the real business impact of your email efforts. Forget the tiny details of individual campaigns and focus on the metrics that tie directly to revenue and growth.
- Subscriber Growth Rate: Is our audience expanding at a healthy clip?
- List Churn Rate: Are we losing subscribers faster than we're gaining them?
- Email Marketing ROI: What's the bottom-line financial return on our email program?
- Email's Influence on CLV: How is email contributing to the long-term value of our customers?
By structuring your reporting this way, you make sure everyone gets the email campaign performance metrics that matter most to them, turning data into decisive action.
Common Measurement Pitfalls to Avoid
It’s easy to get lost in a sea of data, but numbers don't always tell the whole story. Just collecting metrics isn't enough—you have to know how to read them correctly. Falling for common measurement traps can lead you to make bad decisions based on flawed analysis.
Let's walk through some of the biggest pitfalls so you can make sure your strategy is built on solid ground.
One of the most common mistakes we see is an over-reliance on open rates. With Apple's Mail Privacy Protection in the mix, open rates are often inflated and just plain unreliable. A high open rate might feel like a win, but if your click-through and conversion rates are flat, it’s a vanity metric. A great subject line gets the open, but the campaign still fails if your content doesn't connect.
Mistaking Correlation for Causation
Another classic trap is confusing correlation with causation. You might notice that campaigns sent on Tuesday mornings get a higher CTR and assume Tuesday is your magic send day. But what if you just happened to send your most interesting topics on Tuesdays?
Don’t assume one metric is directly causing another. Always dig a level deeper to find the real driver. A simple way to do this is to test variables one by one—like sending the exact same email on different days—to see what’s actually moving the needle.
Failing to Segment Your Analysis
Looking at your overall email performance without segmentation is like trying to understand a city’s economy by looking at its total revenue. It’s a big, messy number that tells you nothing about what’s actually working. Comparing your monthly B2B newsletter to a transactional "password reset" email is pointless since they have completely different goals and audiences.
To get a clear picture, you have to slice your data into meaningful groups:
- By Audience Segment: How do brand-new subscribers engage compared to your most loyal customers?
- By Campaign Type: Are your newsletters outperforming your promotional offers?
- By Goal: Is this campaign built for clicks, demo requests, or direct sales?
Breaker’s real-time analytics makes this easy by letting you filter your results by campaign and audience, so you’re always comparing apples to apples. This segmented view helps you understand why certain campaigns are successful and gives you actionable insights instead of broad, confusing averages.
Finally, a critical mistake is not tracking metrics all the way to conversion. A high CTR feels great, but if those clicks aren’t leading to demo sign-ups, downloads, or sales, the campaign isn't hitting its business goal. Always tie your email metrics back to bottom-line results like ROI and customer lifetime value. That’s how you measure what truly matters.
Frequently Asked Questions About Email Metrics
Even after you get the hang of the basics, some tricky questions about email metrics always seem to surface. Here, we’ll tackle some of the most common ones with direct, no-nonsense answers to help you fine-tune your strategy and troubleshoot with confidence.
How Often Should I Check My Email Metrics?
The answer isn't "all the time." The right cadence depends entirely on what you’re measuring. Think of it in three distinct timeframes.
Within 24 Hours: Check your immediate campaign health. This means looking at deliverability, bounce rates, and unsubscribes. This quick check allows you to spot and fix critical technical issues right away, like a problem with a specific list segment that’s causing a spike in bounces.
Weekly: This is the sweet spot for analyzing engagement. Dive into your open rate, CTR, and CTOR to see what’s working. Looking at these metrics on a weekly basis helps you spot content trends and understand what truly resonates with your audience, giving you actionable insights for the next send.
Monthly or Quarterly: Now it’s time to zoom out. This is when you review your growth and ROI metrics. Assess subscriber growth, list churn, and the overall business impact of your email program to understand its long-term value.
What Is a Good Click-Through Rate for B2B Emails?
A good CTR for most B2B emails typically lands somewhere between 2% and 5%. But that’s not a magic number you have to hit. The “right” CTR depends heavily on your industry, how engaged your audience is, and the type of email you’re sending.
For example, a highly targeted promotional email sent to a warm, engaged list could easily clear 5%. On the other hand, a broad company newsletter sent to a colder audience might perform closer to the 2% mark, and that’s perfectly fine.
The real goal is continuous improvement. Forget chasing a generic industry number and focus on establishing your own baseline CTR. From there, your job is to work on improving it over time.
Why Is My Open Rate High but My Click-Through Rate Is Low?
This is a classic sign of a disconnect between your email's promise and its actual content. Your low Click-to-Open Rate (CTOR) is the giveaway. Your subject line and preview text did their job—they were compelling enough to earn the open. The problem is, the content inside didn't deliver on that initial excitement.
The most common culprits are usually:
- A weak, buried, or confusing call-to-action (CTA).
- Email copy that feels completely unrelated to the subject line.
- A confusing layout or a design that looks terrible on mobile.
To fix this, go back and scrutinize the body of your email. Make sure your message and your CTA align perfectly with the expectations you set in the subject line.
How Do I Measure ROI if My Product Has a Long Sales Cycle?
Measuring direct, immediate ROI is nearly impossible when a sale can take months, or even a year, to close. Don't sweat it. Instead, shift your focus to tracking leading indicators and high-intent micro-conversions.
Instead of looking for immediate sales, measure how many subscribers take the next logical step in their journey with you. These actions could be anything from demo requests and whitepaper downloads to consultation bookings.
Use a multi-touch attribution model in your CRM to connect these initial email-driven actions to the eventual closed-won deal. This ensures your email program gets the credit it deserves for influencing revenue down the line.
Ready to stop guessing and start growing? Breaker combines powerful email sending with automated B2B list growth, giving you real-time analytics to track the metrics that matter. See how you can turn your newsletter into a revenue engine.