
Performance dashboard
What each number and chart on the Performance page means, and how to narrow it to one campaign or a date range.
Performance in the left-hand menu shows how your newsletter is doing over time, across every campaign or for one campaign at a time.
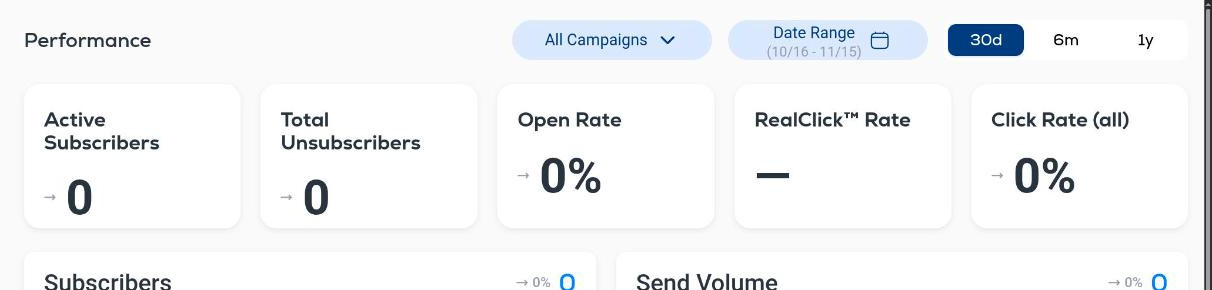
Filters (top right)
- All Campaigns. Open the menu to pick a single campaign and see only its numbers.
- Date Range. Pick a start and end date. The current range is shown under the label.
- 30d, 6m, 1y. Presets for the last 30 days, 6 months or 1 year.
Summary tiles
- Active Subscribers. Contacts who can currently receive your emails.
- Total Unsubscribers. Contacts who have opted out in the selected period.
- Open Rate. Unique opens divided by delivered emails.
- RealClick™ Rate. Clicks made by people, with clicks from security scanners and bots removed, divided by delivered emails. It shows a dash until there is enough data.
- Click Rate (all). All clicks, including automated ones, divided by delivered emails.
The small arrow and percentage next to each tile compare the period with the one before it.
Charts
Each chart plots the selected period day by day and shows the total for the period in its top-right corner.
- Subscribers. Your subscriber count over time.
- Send Volume. How many emails went out each day.
- Opens (Unique). Distinct contacts who opened, per day.
- Clicks (Unique). Distinct contacts who clicked, per day.
- Unsubscribes. Opt-outs per day. A spike after a specific send tells you which email caused it.
- Spam Complaints. Recipients who marked an email as spam. Keep this as close to zero as possible: complaints hurt deliverability for every email you send afterwards.
For precise definitions of opens, clicks, RealClick™ and rates, see Engagement metric definitions. For the numbers of one send, open the campaign itself: see Campaign performance reports.
Support